Article Text

Abstract
Background Sialic acid-binding immunoglobulin-like lectins (SIGLECs) are widely expressed on immune cell surfaces, play an important role in maintaining immune homeostasis and regulating inflammatory responses, and are increasingly emerging as potential targets for tumor immunotherapy. However, the expression profile and crucial role of SIGLEC11 in gastric cancer (GC) remain unclear. This study aimed to elucidate the prognostic relevance of SIGLEC11 expression and its role in the immune microenvironment in patients with GC.
Methods SIGLEC11 expression profile was analyzed using bioinformatics, immunohistochemistry, and immunofluorescence staining. Flow cytometry, mouse tumor models, patient-derived tumor organoid models, and RNA sequencing were used to explore the potential functions with the underlying mechanisms of SIGLEC11 in a coculture system of macrophages and GC cells.
Results We demonstrated that SIGLEC11 was predominantly expressed in normal tissues. However, tumor-infiltrating SIGLEC11+ cells in the high SIGLEC11 expression subgroups showed poor overall survival, which was associated with the expression of an immunosuppressive regulator. Our results showed that SIGLEC11 was predominantly expressed in monocytes and macrophages and selectively upregulated in tumor-associated macrophages. Furthermore, SIGLEC11 promoted macrophage M2 polarization via AKT–mTOR signaling. In addition, SIGLEC11+ macrophages accelerate GC progression.
Conclusions The abundance of SIGLEC11+ M2-like macrophage-infiltrating tumors may serve as a biomarker for identifying immunosuppressive subtypes of GC. Thus, the potential role of SIGLEC11+ M2 macrophages as therapeutic targets warrants further investigation.
- Gastric Cancer
- Macrophages
- Immunosuppression
- Tumor microenvironment - TME
Data availability statement
Data are available upon reasonable request.
This is an open access article distributed in accordance with the Creative Commons Attribution Non Commercial (CC BY-NC 4.0) license, which permits others to distribute, remix, adapt, build upon this work non-commercially, and license their derivative works on different terms, provided the original work is properly cited, appropriate credit is given, any changes made indicated, and the use is non-commercial. See http://creativecommons.org/licenses/by-nc/4.0/.
Statistics from Altmetric.com
WHAT IS ALREADY KNOWN ON THIS TOPIC
Identifying new targets for immunotherapy and screening treatment-sensitive patients with gastric cancer (GC) is critical in GC.
Sialic acid-binding immunoglobulin-like lectins (SIGLECs) are widely expressed on tumor-infiltrating immune cells, and often mediate immunosuppressive effects on binding to SA glycans overexpressed on the surface of tumor cells.
SIGLEC11 is mainly expressed in macrophages in various tissues in humans and plays an important role in macrophage-mediated immune responses.
WHAT THIS STUDY ADDS
In GC, SIGLEC11 is primarily expressed in tumor-associated macrophages (TAMs), and SIGLEC11+ TAMs are associated with tumor progression and adverse prognosis.
SIGLEC11 aids in regulating the immunosuppressive properties of TAMs, promoting the polarization of M2 macrophage, and ultimately helping tumor immune evasion escape immune surveillance.
HOW THIS STUDY MIGHT AFFECT RESEARCH, PRACTICE OR POLICY
SIGLEC11 is expected to emerge as a new target for immunotherapy and a prognostic biomarker for predicting the response of patients with GC.
Background
Gastric cancer (GC) ranks as the fifth most prevalent cancer globally. And it is the fourth primary cause of death.1 Surgery-centered systemic treatment remains the mainstay for patients with GC; however, the prognosis remains poor.2 3 The Checkmate-649 and ORIENT-16 investigations have established immune checkpoint inhibitors in conjunction with chemotherapy which are the usual first-line treatment for patients with late-stage GC.4 5 This combination therapy is the advancing neoadjuvant treatment for locally advanced GC.6 Although neoadjuvant therapy combined with immunotherapy improves the prognosis for locally advanced patients with GC, some remain unresponsive. Thus, identifying the responsive population and adjusting postop treatment based on neoadjuvant efficacy remain a clinical challenge.7 Therefore, identifying new immunotherapeutic targets and screening treatment-sensitive patients with GC are crucial for improving patient outcomes.
Macrophages are an important component of the innate immune response. Macrophages have high plasticity and can be polarized into two phenotypes with opposite functions under different physiological and pathological conditions: M1 macrophages, which are traditionally activated, and M2 macrophages, which are alternately activated.8–10 In the tumor microenvironment (TME), tumor cells recruit and polarize circulating monocytes into tumor-associated macrophages (TAMs). M2 macrophages in the TME can promote tumor growth, angiogenesis, and epithelial–mesenchymal transition and inhibit antitumor immune response mediated by T lymphocytes.11 In addition, CD47 on the surface of tumor cell membranes can interact with signal regulatory proteins on the surface of macrophage membranes to evade phagocytic clearance by macrophages.12 13 Consequently, M2 macrophages significantly contribute to tumor growth. Understanding the heterogeneity and diverse functions of TAMs is necessary to improve immunotherapeutic strategies for GC treatment.
Sialic acid-binding immunoglobulin-like lectins (SIGLECs) are a classical class of type 1 immunoglobulin (Ig)-like lectins, comprising an Ig domain that binds to sialylated ligands, a transmembrane domain, and an intracytoplasmic tail of varying length. SIGLECs are extensively present on tumor-infiltrating T cells, natural killer (NK) cells, neutrophils, dendritic cells and macrophages, frequently inducing immunosuppressive effects on interaction with sialic acid (SA) glycans that are overexpressed on tumor cell surfaces; therefore, there is growing interest among researchers in developing SIGLECs as alternative or complementary immune checkpoints.14 15 Barkal et al16 showed that the interaction between CD24 cells expressed on breast cancer cells and SIGLEC-10 on TAMs inhibits TAMs-mediated phagocytosis, thus mediating tumor immune escape. Wang et al17 detected another SIGLEC, SIGLEC15, in TAMs. SIGLEC15 induces TAMs to produce transdermal growth factor (TGF)-β and inhibit T cell proliferation and activation after binding to SA-Tn antigen on the tumor cell surface. In summary, over the past few decades, SIGLECs represent newly discovered ‘immune checkpoints’, and studies on the mechanism underlying their regulation of the immune system have made considerable progress. Currently, several antitumor drugs and related cell therapies targeting SIGLEC family members and their ligands have been marketed or are undergoing clinical studies, providing new strategies for tumor immunotherapy.
SIGLEC11 mediates SA binding to cells and specifically binds to polysaccharide ligands to reduce inflammatory responses. In immune responses, these ligands recruit cytoplasmic phosphatases through the SH2 domain to induce tyrosine phosphorylation, whereas SIGLEC11 acts as an inhibitory receptor, blocking signaling pathways through the dephosphorylation of signaling molecules.18 SIGLEC11 is mainly expressed in the macrophages of various human tissues and plays an important role in macrophage-mediated immune responses.19
This study aimed to elucidate the prognostic relevance of SIGLEC11 expression and its role in the immune microenvironment in patients with GC.
Methods
Tissue samples
Tissue samples from patients with GC, including paired tumor, adjacent non-tumor, and normal tissues, were collected for reverse transcription-quantitative polymerase chain reaction (RT-qPCR) assay. Thirty of these samples were used for immunohistochemistry (IHC) and immunofluorescence (IF) staining. Samples were obtained at Ruijin Hospital (Shanghai, China) from January 2016 to June 2019, before any preoperative intervention. The Ethics Committee of Ruijin Hospital approved the collecting of human tissue samples.
Cell culture
GC cell lines (MKN45 and AGS) and leukemic monocytes (THP-1) were acquired from the Cell Bank of the Chinese Academy of Sciences (Shanghai, China), accompanied by verified short tandem repeat (STR) profiling. MKN45 and AGS cells were cultivated in DMEM with 10% fetal bovine serum (FBS) (Gibco, Life Technology) and 1% penicillin/streptomycin (P/S) (Meilunbio, China, MA0110), whereas THP-1 cells were cultured in Roswell Park Memorial Institute 1640 (RPMI-1640) with 10% FBS and 1% P/S. All cells were grown in a humidified incubator (Heal Force) at 37℃ with 5% CO2.
Isolation of primary peripheral blood mononuclear cells (PBMCs)
After obtaining informed consent from the donors, fresh peripheral blood from healthy individuals was collected in 5 mL anticoagulated syringes. The blood was centrifuged at 1500 r/min for 10 min, and the serum was aspirated. PBMC was isolated using the lymphocyte separation medium (YEASEN, China, 40 504ES60) according to the manufacturer’s instructions. Subsequently, 3 mL of RPMI 1640 medium supplemented with 10% FBS was introduced. The bottom sediment was gently mixed with a pipette to obtain PBMC.
Macrophage polarization
To polarize the THP-1 to M1 type, we first used 100 ng/mL of phorbone (PMA) to stimulate THP-1 for 48 hours, then with 50 ng/mL of lipopolysaccharide (Beyotime, China, S1732) and 20 ng/mL of interferon (IFN)-γ (PeproTech, US, 300-02) stimulated for 48 hours. Alternatively, 20 ng/mL of interleukin (IL)-4 (PeproTech, US, 20 000-04) was added during the last 48 hours to polarize the cells to an M2 phenotype.
To polarize macrophages to M2, we first adhered PBMCs to the culture surface for 24 hours to obtain macrophages. Subsequently, we added 20 µg/mL of macrophage colony-stimulating factor (M-CSF) (PeproTech, US, 300-25) for 6 days, followed by 20 ng/mL of IL-4 to polarize the macrophages to an M2 phenotype after processing.
Reverse transcription-quantitative polymerase chain reaction
Total RNA was isolated with a SteadyPure Rapid RNA Extraction Kit (Accurate Viology, China, AG21023), and reverse transcription was conducted with HiScript III RT SuperMix (Vazyme, China, R323-01). The analysis used ChamQ Universal SYBR qPCR Master Mix (Vazyme, China, Q711-02) following the manufacturer’s guidelines, and detection was conducted with qTOWER384G (Analytik Jena). The data were normalized to the mRNA expression of glyceraldehyde phosphate dehydrogenase and computed using the 2−ΔΔCT method. The primer sequences are provided in online supplemental table S1.
Supplemental material
Western blot
Total protein from cell lines was extracted utilizing cell lysis buffer (Epizyme, China, PC102) in conjunction with a complete inhibitor (NCM Biotech, China, P001), subsequently loaded and separated via sodium dodecyl sulfate-polyacrylamide gel electrophoresis, transferred to polyvinylidene difluoride membranes (Millipore, USA, IPVH00010), and then incubated with antibodies. The principal antibodies used in this study are enumerated in online supplemental table S2.
Supplemental material
IHC assay
IHC staining was conducted at the Shanghai Institute of Digestive Surgery in accordance with an established standard technique. The staining intensity and the quantity of positively stained GC cells were categorized into four distinct ranges. The ultimate staining score was determined using the formula:

IF staining
Deparaffinization, hydration, and 3% H2O2 quenching of tumor sections were followed by immersion in citrate buffer, heat-induced antigen retrieval, and IF staining. The application of primary antibodies and fluorescent-conjugated secondary antibodies was succeeded by 4′,6-diamidino-2-phenylindole staining to visualize nuclei. Images were obtained using an Olympus BX50 microscope (Olympus, Tokyo, Japan). Online supplemental table S2 enumerates the antibodies used in this work.
Flow cytometry
The immunocytes were rinsed with phosphate-buffered saline (PBS) and treated with 1% bovine serum albumin in PBS on ice. The cells were stained with fluorochrome-conjugated antibodies for 30 min at 4°C, in accordance with the manufacturer’s instructions. The samples were ultimately examined with the CytoFLEX S (Beckman). The antibodies employed in this work are enumerated in online supplemental table S2.
Plasmids and lentivirus transduction
During transient transfection, appropriate amounts of plasmid (OBiO Technology, Shanghai, China) and Hilymax (H357, Dojindo, Japan) were gently mixed with the cells, followed by incubation for 8 hours before replacing the medium. Protein or mRNA expression was assessed 3 days post-transfection, with the effect lasting for approximately 2 weeks. For stable transfection, appropriate lentivirus (Genechem, China) was added into the supernatant for 8 hours before the medium was replaced, and then stably transfected cells were picked using 2 µg/mL puromycin (Meilunbio, China, MB2005-1) for 48 hours as per manufacturer’s instructions.
ELISA
Using an ELISA kit, we analyzed the supernatants from GC cells to determine the concentrations of IL-10 (ABclonal, China, RK00012), IL-6 (ABclonal, China, RK00012), TNF-B1 (ABclonal, China, RK00055), and M-CSF (ABclonal, China, RK00044). Following centrifugation at 3000 rpm for 10 min, the supernatant was obtained and centrifuged at the same speed to obtain the supernatant. The supernatant was stored in an Eppendorf (EP) tube (1.5 mL) for further analysis. We strictly followed the instructions in the ELISA kit manual to measure the expression of four proteins: IL-10, IL-6, TNF-B1, and M-CSF. Optical density (OD) values were measured at 450 nm, and expression levels were calculated. This process was repeated three times. The concentration of each cell factor was calculated based on the standard protein concentration curve obtained using the ELISA kit.
Animal experiments
Nude mice (4–6 weeks old, n=12) were acquired from PhenoTek Biotechnology (Shanghai, China). In the subcutaneous xenograft experiment, mice were randomly assigned to each group (n=6) for experimental purposes. The GC MKN-45 cell line and different levels of SIGLEC11-expressing macrophages were mixed and subcutaneously injected into the lateral aspect of the mice. Tumors were assessed every 5 days and estimated using the formula (length×width×width/2). After 3 weeks, the mice were sacrificed, and the tumor weight was evaluated. Tumors were immediately harvested, frozen in liquid nitrogen, or fixed in 4% formalin. The experiments followed the ARRIVE1 reporting guidelines.20
Patient-derived organoids (PDOs) model and coculture system of PDO
Following GC resection at the Ruijin Hospital, all patients were pathologically diagnosed with GC. Informed consent was obtained to collect GC samples. Surgical samples were washed with PBS containing dual antibiotics and cut into pieces. The tissue fragments were digested with type-IV collagenase (Sigma, USA) at 37°C for 1 hour. The organoids were embedded in Matrigel (356231; Corning, USA) and covered with human GC organoid culture medium (WM-H-09; OuMel, China) after filtering and digesting the organoid-containing tissue suspension to remove residual tissue.
Subsequently, an appropriate amount of TrypLE Express Enzyme (12604013, ThermoFisher, USA) was added, and the Matrigel was dispersed. The dish was placed in a 37℃ incubator for digestion for 10–15 min. The pipette was pipetted several times and observed until most of the organoids were digested into single cells. Next, 1 mL of serum-free Dulbecco's Modified Eagle Medium (DMEM) was introduced, and the cells were relocated to a 15 mL centrifuge tube, followed by centrifugation at 800 rpm for 5 min. The supernatant was then discarded. Subsequently, 1 mL of PBS was introduced, the cell pellet was resuspended, permitted to stand for 1 min, centrifuged at 800 rpm for 5 min, and the supernatant was removed. Equal amounts of macrophages and organoids were collected, the cell concentration was adjusted to 1×10⁶ /mL with serum-free DMEM, and an equal volume of Matrigel was added. The mixture was then mixed, and 8 µL was seeded into a 96-well plate. The plate was inverted and incubated for 30 min until the gel solidified. Moreover, 150 µL of complete organoid medium per well was added. Sterile PBS or water was added to the peripheral wells to prevent evaporation. The coculture system of PDO was observed and photographed daily using a Countstar Castor S1 (Countstar, China). GC organoids were identified as green using an AI algorithm.
Data acquisition
Transcriptome profiles and clinical data of patients with GC were sourced from The Cancer Genome Atlas (TCGA), whereas gene expression data for normal tissues were acquired from the Genotype-Tissue Expression Portal (GTEx). Microarray data pertaining to the GC expression profile (GSE183436) were retrieved from the Gene Expression Omnibus (GEO) database. All gene expression data were normalized and batch-processed using the limma R program.
Prognostic analysis
Kaplan-Meier survival analysis was employed to ascertain the survival prognosis of individuals with GC. Patients were categorized into ‘high’ or ‘low’ groups according to the median level of SIGLEC11 expression. Outcomes are shown as HRs, 95% CIs, and log-rank p values.
Gene set enrichment analysis (GSEA)
The TCGA database was used to classify GC tumor samples into two groups based on SIGLEC11 mRNA expression. Significant biological pathways were identified in the gene set and GSEA was conducted to determine pathways enriched in SIGLEC11 high tumor samples.
Differential expression analysis
The Limma moderated t-test was used for differential expression analysis of genomic data, identifying significantly upregulated and downregulated genes between SIGLEC11 high and SIGLEC11 low tumor samples. These genes were classified as expressed with a false discovery rate-adjusted p value of <0.05 and a fold change of ≥1.5.
Immune infiltration analysis
The ESTIMATE database was employed to examine the relationship between immune-associated scores, clinical characteristics, and SIGLEC11 mRNA expression. CIBERSORT was used to assess the amounts of immune cell infiltration correlated with SIGLEC11 mRNA expression.
Statistical analysis
The biological experiments were conducted a minimum of three times. The analysis was conducted with GraphPad Prism (V.8.0). The Student’s t-test or the Wilcoxon rank-sum test was employed for continuous variables. Spearman’s correlation coefficients were employed for correlation analysis. The Kaplan-Meier method assessed overall survival (OS), whereas the log-rank test was employed to compare survival across groups. Data are expressed as means±SD, with p<0.05 being statistically significant.
Results
SIGLEC11 expression is low in GC and is associated with poor prognosis
SIGLEC family genes have rarely been investigated in GC; however, TCGA-STAD data can be processed and analyzed to reveal the comprehensive mRNA expression of SIGLEC family genes. From TCGA-STAD data, we found that SIGLEC family genes were aberrantly expressed in tumor tissues relative to normal tissues, in which most genes, including SIGLEC7, SIGLEC9, SIGLEC10, SIGLEC12, and SIGLEC14, were significantly upregulated in tumor tissues from both overall tumor and normal tissue samples (figure 1A) and paired sample data (figure 1B). Among the rest of the SIGLEC family members, SIGLEC11 showed unique characteristics, such as lower expression in tumor tissues, which drew our attention. Subsequently, GEO databases were used to compare SIGLEC family gene expression levels between tumor and paired normal tissues. Based on the GSE 183436 dataset, SIGLEC11 was downregulated in tumor tissues, which was consistent with the results from TCGA-STAD (figure 1C and A).

SIGLEC11 is low in GC and is associated with prognosis in GC. (A) Boxplots showing SIGLECs family gene expression following log2 (TPM+1) normalization of data for normal tissues and GC tissues using TCGA RNA-seq data. (B) Boxplots showing SIGLEC expression following log2 (TPM+1) normalization of data for paired normal tissues and GC tissues using TCGA RNA-seq data. (C) RNA-sequencing data analysis of tumor and normal tissues based on data from GEO database (GSE 183436) are presented as a heatmap plot. (D) The mRNA level of SIGLEC11 in 30 pairs of GC tissues and their paired normal tissues. (E, F) Immunohistochemical staining score of SIGLEC11 in tumor tissue, non-tumor tissues, and normal tissues, and representative IHC staining of SIGLEC11 protein are presented. (G) Survival curve was used to analyze OS in the low-SIGLEC11 and high-SIGLEC11 groups in the TCGA-STAD database (National Genomics Data Center). (H) Survival curve was used to analyze OS, PPS, and PF in the low-SIGLEC11 and high-SIGLEC11 groups in GEO database. (I) Survival curve was used to analyze the association between SIGLEC11 mRNA expression levels and OS in various tumors (including adrenocortical carcinoma, glioblastoma multiforme, uveal melanoma, acute myeloid leukemia and brain lower grade glioma). *p<0.05, **p<0.01, ***p<0.001. ACC, adrenocortical carcinoma; GBM, glioblastoma multiforme; GC, gastric cancer; GEO, Gene Expression Omnibus; IHC, immunohistochemistry; LAML, acute myeloid leukemia; LGG, brain lower-grade glioma; mRNA, messenger RNA; OS, overall survival; PF, progression-free; PPS, postprogression survival; SIGLEC, sialic acid-binding immunoglobulin-like lectin; STAD, stomach adenocarcinoma; TCGA, the cancer genome atlas; UVM, uveal melanoma.
Thirty paired tumors and normal tissues were collected to investigate the mRNA expression of SIGLEC11 via RT-qPCR. The results showed that SIGLEC11 expression was markedly lower in tumor tissues compared with normal tissues (figure 1D), which was consistent with the TCGA and GEO data. IHC was conducted to further confirm that SIGLEC11 protein expression was decreased in the tumor tissues (figure 1E and F). Overall, SIGLEC11 was differently expressed in GC samples from the rest of the members of the SIGLEC family genes.
Next, we performed Kaplan-Meier analysis to investigate the effect of SIGLEC11 expression on GC prognosis and found that increased levels of SIGLEC11 were linked with worse OS (HR=1.6; 95% CI: 1.27 to 2.02; p<0.001), PF (HR=1.55; 95% CI: 1.2 to 2; p<0.001), PPS (HR=1.78; 95% CI: 1.34 to 2.37; p<0.001) via analyzing TCGA-STAD and GEO data (figure 1G and H). External datasets indicated that elevated SIGLEC11 mRNA levels could forecast unfavorable OS in many tumors (figure 1I and B).
Immune aspects of SIGLEC11 in the TME
Increasing evidence suggests that the SIGLEC family proteins are mostly and specifically articulated on the surfaces of myeloid and immune cells. Here, we used the ESTIMATE database to investigate the level of immune infiltration and understand relationship between SIGLEC11 and the immune system in GC. TCGA-STAD samples were categorized into high-expression and low-expression cohorts according to the median SIGLEC11 expression data. Statistical disparities were noted in the ESTIMATE, immunological, and stromal scores between the two groups. Spearman correlation analysis indicated a positive association between SIGLEC11 expression with ESTIMATE, immunological, and stromal scores (online supplemental figure S2A). Here, we investigated the correlation between immune cells and SIGLEC11 expression based on gene set variation analysis, indicating that high SIGLEC11 expression was markedly linked with dendritic cells and macrophages, which are considered to be derived from monocytes (figure 2A). To investigate the correlation between SIGLEC11 and the tumor immune cell infiltration landscape, we employed the CIBERSORT algorithm to determine the relative proportions of 22 immune cell types in TCGA-STAD. The proportions of M0, M1, and M2 macrophages in the tumor samples were relatively high, whereas the proportion of monocytes was relatively low. Furthermore, in comparison to the tumor group, the fraction of monocytes in the normal group was comparatively elevated, and there is no difference in the proportion of M2 macrophages, according to TCGA-STAD data (online supplemental figure S2B, C). Additionally, we compared the percentages of SIGLEC11 high-expression and low-expression groups in different types of immune cells. The results showed that in both monocytes and M2 macrophages, the percentage of SIGLEC11 high-expressing groups was higher, whereas in M1 macrophages, the percentage of SIGLEC11 low-expressing groups was higher (figure 2B). Additionally, we comprehensively analyzed the expression characteristics of inhibitory receptors in TCGA-STAD data and verified that SIGLEC11 showed significant positive correlations with various M2 biomarkers and markers of T-cell exhaustion (figure 2C). In summary, SIGLEC11 plays a crucial role in immune infiltration across various cancers and may serve as a novel immunotherapeutic target for tumor treatment.
Supplemental material

Immune aspects of SIGLEC11 in the tumor microenvironment. (A) The relationship between SIGLEC11 expression levels and the levels of immune cell subpopulations. (B) There were 22 immune cell subpopulations in the SIGLEC11-high expression group compared with the low expression group in GC. (C) Correlation between SIGLEC11 and immunosuppressive genes in TCGA-STAD database. (D–J) Analysis of SIGLEC11 gene expression in various tumors using the pan-cancer single-cell sequencing data set. *p<0.05, **p<0.01, ***p<0.001, ****p<0.0001. GC, gastric cancer; PAAD, pancreatic adenocarcinoma; SIGLEC, sialic acid-binding immunoglobulin-like lectins; STAD, stomach adenocarcinoma; TCGA, the cancer genome atlas.
SIGLEC11 was selectively upregulated in TAMs
Numerous studies have shown that SIGLEC11 is primarily expressed in monocytes and macrophages.21 Single-cell RNA sequencing data and IF analyses were employed to identify SIGLEC11 mRNA and protein expression in GC. First, we examined SIGLEC11 expression in various types of cancers and found that SIGLEC11 was specifically expressed in macrophages and monocytes of various tumors (figure 2D–J and online supplemental figure S2D–J). We observed that SIGLEC11 expression positively correlated with CD14 (a marker gene for monocytes and macrophages) (online supplemental fiure S3A). Furthermore, we validated the colocalization of SIGLEC11 with macrophages and monocytes in GC through multiple IF staining (figure 3A). Additionally, the data showed that, in tumor tissues, SIGLEC11 and CD14 colocalized and were both expressed at low levels. SIGLEC11+CD14+ immune cells were more abundant in normal tissues, implying that the low expression of SIGLEC11 in tumor tissues was due to relatively fewer monocytes and macrophages in tumor tissues than in adjacent tissues (figure 3B–D).

SIGLEC11 is selectively upregulated in TAMs. (A) Representative images of Immunofluorescence staining for SIGLEC11, CD14, CD4, and CD8 in tumor tissues, adjacent non-tumor tissues, and normal tissues. (B–D) Immunofluorescence staining analysis showing that an evident fluorescent signal of SIGLEC11, CD14, and SIGLEC11 colocalized with CD14 in the normal tissue sections compared with that in the tumor group. (E) Representative images of Immunofluorescence staining for SIGLEC11, CD86, and CD206 in tumor tissues and normal tissues. (F) Immunofluorescence staining analysis showing that an evident fluorescent signal of SIGLEC11 colocalized with CD206 in the tumor tissue sections, CD206 were more gathered in SIGLEC11 high expression group, no differences of SIGLEC11 colocalized with CD86 between tumor and normal tissues was found. *p<0.05, ***p<0.001. SIGLEC, sialic acid-binding immunoglobulin-like lectin; TAMs, tumor-associated macrophages.
Polarized macrophages are referred to as M1 and M2 cells.22 Subdividing the macrophage subtypes, we found that SIGLEC11 was highly expressed in M2 macrophages and monocytes in GC (figure 2D). Furthermore, multiple IF staining results showed that compared with normal tissues, SIGLEC11 colocalized with more CD206+ M2 and CD163+ M2 macrophages in tumor tissues, whereas colocalization with CD86 did not show statistically significant differences (figure 3E and F and online supplemental figure S3B–D). Human THP-1 macrophages were activated with different cytokines to elicit M1 or M2 polarization. Our findings indicated that in M2 macrophages, the mRNA expression of SIGLEC11 was elevated, while in M1 macrophages, SIGLEC11 expression was decreased (online supplemental figure S3E). Monocyte-derived macrophages were then differentiated into TAMs using the culture medium from GC cell lines. RT-qPCR revealed that, compared with the control, SIGLEC11 mRNA expression was markedly elevated in TAMs (online supplemental figure S3F).
SIGLEC11 promotes macrophage polarization toward the M2 phenotype
To examine the regulatory role of SIGLEC11 in M2 polarization, we employed lentiviral transduction to overexpress SIGLEC11 in THP-1 cells, thereby establishing stable overexpressing cell lines. THP-1 cells were stimulated to develop into M0 macrophages using PMA and subsequently polarized to the M2 phenotype using IL-4. The findings indicated that, in comparison to the control group, the expression of M2 markers was elevated in the SIGLEC11 overexpression group (figure 4A). Next, we extracted monocyte-derived macrophages from PBMC and transfected them with SIGLEC11 overexpression plasmid. The cells were then polarized toward M2 phenotype using IL-4. The expression of M2 markers was markedly elevated in the overexpression group compared with the control group (figure 4B). We used a lentiviral knockdown to reduce the expression of SIGLEC11. No differences were observed in the expression of the M2 markers (figure 4C and D). This may be due to the relatively low basal expression of SIGLEC11. In addition, we detected the expression of several M1 markers in THP-1 cells and mononuclear cell-derived macrophages. Our results showed that SIGLEC11 overexpression significantly downregulated the expression of M1 markers (online supplemental figure S4A–C).

SIGLEC11 promotes macrophage polarization towards the M2 phenotype. (A) A SIGLEC11-overexpressing cell line was constructed using the human monocyte cell line THP-1, and then the engineered THP-1 cells were induced to differentiate into M0 macrophages with PMA. IL-4 was used to stimulate M0 macrophages to polarize into the M2-phenotype, and the expression levels of SIGLEC11 and M2 markers (CD206, TGFB1, and CD115) were measured by RT-PCR. (B), Monocyte-derived macrophages from PBMC were transfected with SIGLEC11 overexpression plasmid and polarized into the M2-phenotype using IL-4. The expression of M2 markers were measured by RT-qPCR. (C, D) A SIGLEC11-knockdown cell line was constructed using the human monocyte cell line THP-1, and then the engineered THP-1 cells were induced to differentiate into M0 macrophages with PMA. IL-4 was used to stimulate M0 macrophages to polarize into the M2-phenotype, and the expression levels of M2 markers (CD206, TGFB1) were measured by RT-qPCR. (E) PBMC was extracted in vitro and induced into monocyte-derived macrophages using M-CSF. The monocyte-derived macrophages were then transfected with SIGLEC11 overexpression plasmid on day 7. After 48 hours, the macrophages were cultured in MKN-45 cells conditioned medium (MKN45-CM) or AGS cells conditioned medium (AGS-CM) for 48 hours. (F–K) Study of the effect of SIGLEC11 expression on macrophage polarization in vitro. (F, G) The proportion of M2 macrophages in each group of macrophages was detected by flow cytometry. (H, I) The expression levels of CD206, TGFB1 and CD115 were measured by RT-qPCR. (J, K) The proportion of M2 macrophages in each group of macrophages was detected by flow cytometry. (L–N) The expression levels of IL-10, TGFB1, IL-6, and M-CSF were measured by Elisa. *p<0.05, **p<0.01, ***p<0.001, ****p<0.0001. CM, conditioned medium; IL, interleukin; M-CSF, macrophage colony-stimulating factor; PBMC, peripheral blood mononuclear cell; PMA, phorbol 12-myristate 13-acetate; RT-qPCR, quantitative real-time PCR; SIGLEC, sialic acid-binding immunoglobulin-like lectin; TGF, transdermal growth factor; THP-1, leukemic monocytes.
To more accurately replicate the interaction between tumor cells and macrophages in the TME, we generated conditioned media (CM) from human GC cells and cocultured THP-1 cells and monocyte-derived macrophages overexpressing SIGLEC11 with the CM to facilitate their differentiation into TAMs (figure 4E). Our results indicated that, compared with the blank control group, the addition of CM significantly upregulated the expression of M2 marker mRNAs, and overexpression of SIGLEC11 promoted the expression of M2 markers in THP-1 (online supplemental figure S4D, E). Next, flow cytometry (fluorescence activated cell sorting (FACS)) analysis showed that SIGLEC11 overexpression increased the expression of CD163 and CD206 proteins in TAMs, suggesting that high levels of SIGLEC11 promoted M2 macrophage differentiation in TAMs (figure 4F and G and online supplemental figure S4F). Furthermore, constructing SIGLEC11 overexpressing monocyte-derived macrophages for the same experiment yielded consistent results (figure 4H–K and G).
We used CM to activate THP-1 and monocyte-derived macrophages with differing amounts of SIGLEC11 expression to differentiate into TAMs, from which we collected the TAM culture medium. Our findings indicated that, relative to the control group, the expression of immunoinhibitory cytokines (IL-10 and TGFB1) in the TAM culture media of the SIGLEC11 overexpression group was significantly elevated (figure 4L). Conversely, IL-6 expression decreased (figure 4M), suggesting that SIGLEC11+ macrophages possess stronger immunosuppressive capabilities. Furthermore, SIGLEC11-overexpression upregulated the level of M-CSF in the TAM culture medium (figure 4N), which can induce macrophages to enter an M2-like polarized state.
SIGLEC11 promotes M2 polarization by activating the AKT/mTOR signaling pathway
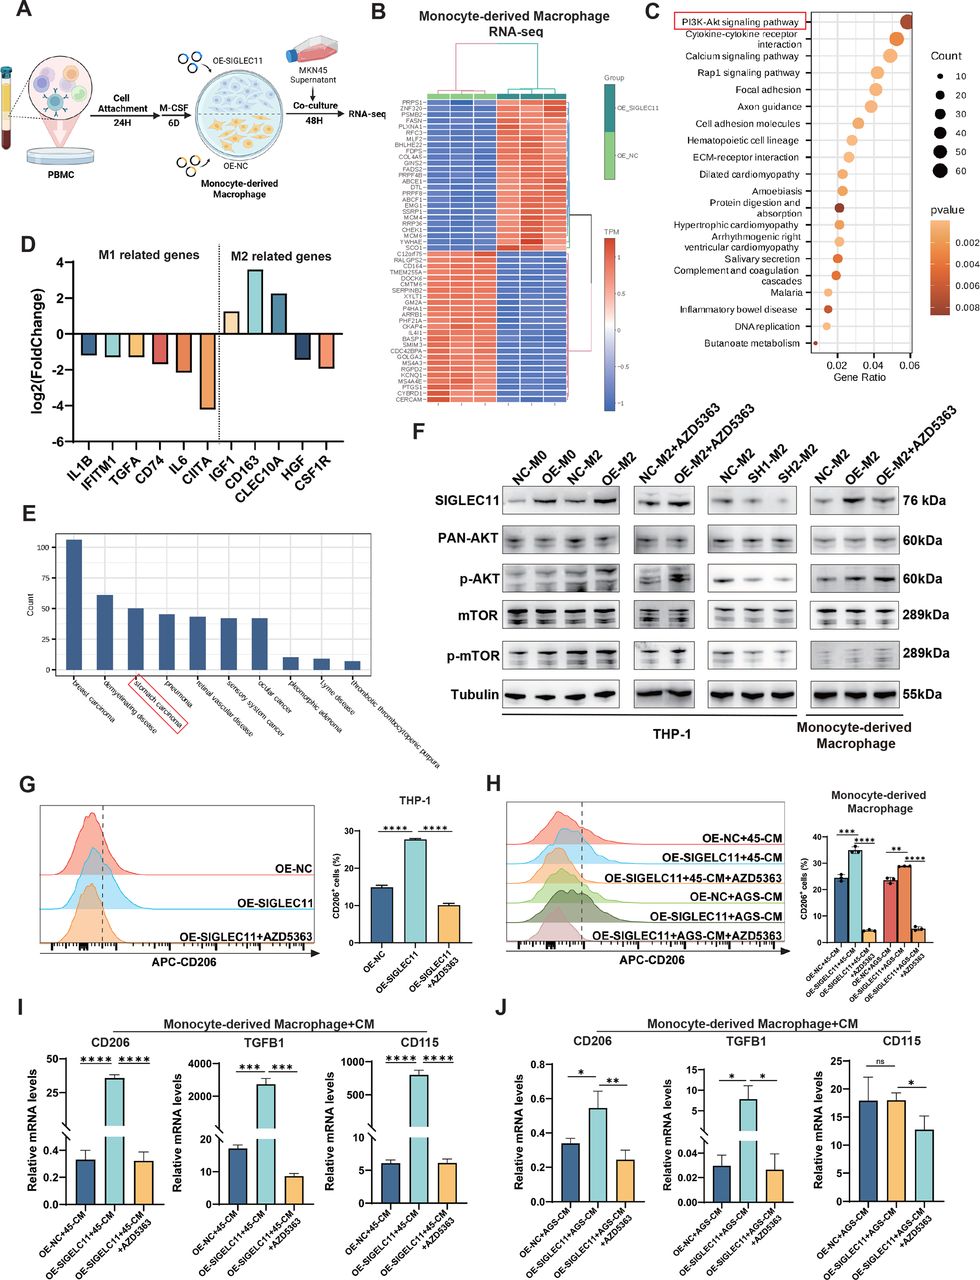
To examine the molecular mechanism via which SIGLEC11 facilitates M2 polarization, we transfected monocyte-derived macrophages with a SIGLEC11 overexpression plasmid or a control plasmid. Following 48 hours of stimulation with MKN45-CM (figure 5A), we saw a substantial enrichment of the PI3K/AKT/mTOR pathway in macrophages expressing SIGLEC11 (figure 5B, C). Additionally, RNA-seq analysis of these TAMs indicated that certain M2-type macrophage-related genes were increased in the SIGLEC11-overexpressing group, while the majority of M1-type macrophage-related genes were downregulated (figure 5D). Moreover, disease ontology (DO) enrichment analysis revealed that genes in the GC pathway were highly enriched (figure 5E).

SIGLEC11 promotes M2 polarization through activation of the AKT/mTOR signaling pathway. (A) PBMC transfected with a SIGLEC11-overexpression plasmid or control plasmid on day 7. After transfection for 48 hours, the cells were stimulated to induce TAMs and collected for RNA-seq analysis. (B) Heatmap showing the differential expression of genes in SIGLEC11-overexpressing TAMs versus control TAMs. (C) Bubble chart showing the results of KEGG enrichment analysis. (D) Gene expression analyses of M1 and M2 macrophage-related genes in SIGLEC11-overexpressing TAMs relative to that in control TAMs. (E) Bar chart showing the results of DO enrichment analysis. (F) Macrophages with different SIGLEC11 expression levels were stimulated, followed by western blotting to detect the expression of SIGLEC11, p-AKT, PAN-AKT, p-mTOR, and mTOR. (G–J) SIGLEC11-overexpressing macrophages were pretreated with or without the AKT inhibitor AZD5363 and then stimulated with CM for 48 hours. Flow cytometry and RT-qPCR were performed to detect the expression of M2 markers. *p<0.05, **p<0.01, ***p<0.001, ****p<0.0001. M-CSF, macrophage colony-stimulating factor; PBMC, peripheral blood mononuclear cell; SIGLEC, sialic acid-binding immunoglobulin-like lectin; TAMs, tumor-associated macrophages.
Next, to investigate whether this pathway mediates SIGLEC11’s regulation of M2 polarization in macrophages, we stimulated THP-1 cells and macrophages derived from monocytes with MKN45-CM, which induces the differential expression of SIGLEC11. This mimicked the tumor cell polarization of macrophages. Our findings demonstrated that SIGLEC11 facilitated the phosphorylation of AKT and mTOR in macrophages (figure 5F). Additionally, we treated SIGLEC11 overexpressed macrophages with an AKT inhibitor (AZD5363), which significantly suppressed the role of SIGLEC11 in the upregulation of M2-type markers in THP-1 cells and macrophages (figure 5G–J).
SIGLEC11-positive macrophages can accelerate the progression of GC
To investigate whether SIGLEC11 regulates tumor growth in vivo by modulating macrophage polarization, we injected the GC cell line MKN-45 and macrophages with different SIGLEC11 expression levels into the subcutaneous tissues of nude mice (figure 6A). The results showed that when GC cells were cocultured with macrophages overexpressing SIGLEC11, tumor growth was significantly enhanced (figure 6B–D). Subcutaneous tumors were divided into groups and digested to obtain single-cell suspensions for subsequent staining. The results showed that the proportion of M2 macrophages in the overexpressed SIGLEC11 group was significantly increased (figure 6E). Subsequently, we used subcutaneous tumors for RT-qPCR and immunohistochemical staining and observed that the infiltration level of M2-TAMs in the overexpressed SIGLEC11 group was significantly increased (figure 6F–H), which further validated our conclusion. Subsequently, we established a coculture model of GC organoids and macrophages with different levels of SIGLEC11 expression and performed a z-axis scan of the organoids. The data showed that the quantity of organoids in overexpressed SIGLEC11 group was elevated (figure 6I). Hence, SIGLEC11+ macrophages can accelerate the progression of GC.

SIGLEC11-positive macrophages can accelerate the progression of GC. (A) Flow diagrams of animal experiments and the coculture system of macrophages and PDO. (B) Representative images of tumors in mice from different treatment groups. (C, D) Tumor growth and quantification for tumor weight of subcutaneous tumors in the indicated groups. (E) The proportion of M2 macrophages in each group of macrophages was detected by flow cytometry. (F) The expression levels of M2 markers were measured by RT-qPCR. (G, H) IHC staining with CD206-specific antibodies and CD163-specific antibodies to detect M2 macrophage infiltration in subcutaneously transplanted MKN-45 tumors. The number of CD206-positive or CD163-positive cells per high-power field was counted in subcutaneous tumor sections from each group of mice. I, Representative images of organoids in each group. **p<0.01, ***p<0.001, ****p<0.0001. GC, gastric cancer; IHC, immunohistochemistry; IL, interleukin; M-CSF, macrophage colony-stimulating factor; PDO, patient-derived organoid; RT-qPCR, reverse transcription-quantitative polymerase chain reaction; SIGLEC, sialic acid-binding immunoglobulin-like lectin.
Discussion
Recent advances in tumor immunotherapy have highlighted the potential of immune checkpoint inhibitors.23 24 However, drug resistance remains a major obstacle. Consequently, identifying new targets that regulate tumor immune suppression is a crucial focus in antitumor medication development. One such target is SIGLEC, a type I lectin family member that recognizes cell membrane proteins containing glycans. Presently, 15 human SIGLEC family members are primarily expressed in immune cells. With further studies, SIGLEC has become an important antitumor target.
Similar to PD-1/PD-L1 immune checkpoints, SIGLEC receptors are phosphorylated and inhibit intracellular immune signaling on binding with sialylated ligands.25 26 In the TME, the expression of inhibitory SIGLECs' ligands in tumor cells increases, aiding immunological evasion.27 28 Multiple SIGLEC receptors establish an immunosuppressive microenvironment in cancer.28 Sialylated polysaccharides interact with innate and adaptive tumor immune cells in three main ways. First, SIGLEC receptors bind to ligands, inhibiting T cell activation and regulating SH1 and SH2 phosphatase recruitment through T cell receptor signaling. Second, SIGLEC-mediated interactions can polarize TAMs into M2-like protumorigenic phenotypes. Third, SIGLEC inhibits NK cell-mediated tumor-killing function.29 Given that SIGLEC11 is highly expressed in monocytes and macrophages, we conducted the following experiments.
This study analyzed SIGLECs gene expression using TCGA-STAD and GEO data, revealing that SIGLEC11 was underexpressed in GC tumor samples compared with normal tissues. RT-qPCR and IHC confirmed SIGLEC11 mRNA and protein expression, consistent with TCGA-STAD and GEO analyses. Unlike other SIGLEC family members, SIGLEC11 is rarely reported and is notable for its high expression in normal tissues. Further investigation is needed to understand SIGLEC11’s role in the GC immune microenvironment. Evidence suggests SIGLECs are primarily localized on immune cells rather than tumor cells, with SIGLEC11 mainly detected in monocyte–macrophage cells. To investigate the reasons for the low expression of SIGLEC11 in tumor tissues, we found significant correlations between SIGLEC11 expression and ESTIMATE, immune, and stromal scores, which were negatively associated with tumor purity. Furthermore, we observed differences in immune infiltration between tumor and normal tissues in GC samples from TCGA-STAD, in which memory B cells, plasma cells, memory CD4+ T cells, and monocytes were highly clustered in normal tissues. IF results showed significantly higher numbers of CD14+ monocytes, SIGLEC11+ immune cells, and the co-expressed CD14+SIGLEC11+ monocytes in paired normal tissues compared with paired tumor tissues. Collectively, CD14+SIGLEC11+ immune cells accounted for a large proportion of SIGLEC11+ immune cells, which were significantly larger in normal tissues, explaining low SIGLEC11 expression in GC.
Although SIGLEC11 was less expressed in tumor tissues, it was not considered an inhibitory factor in GC progression. Kaplan-Meier survival analysis indicated that patients with GC and higher SIGLEC11 expression had poorer OS. The CIBERSORT algorithm revealed significant differences in immune cell distribution between SIGLEC11 high and low-expression groups in TCGA-STAD data, including a greater proportion of M2 macrophages in the SIGLEC11 high group. Correlation analysis showed a positive relationship between the gene markers of M2 macrophages and SIGLEC11. IF staining suggested a larger proportion of CD163+ M2, CD206+ M2 macrophages, CD163+SIGLEC11+, and CD206+SIGLEC11+ immune cells (SIGLEC11+ M2 macrophages) in the SIGLEC11 high-expression group. Infiltration of M2 macrophages in many tumors, including GC, predicts poor prognosis.27 28 30 Based on these results, SIGLEC11+ M2 macrophages, as a subtype of M2 macrophages with low SIGLEC11 expression in tumor tissues, could act as a worse prognostic factor in the GC group.
This led us to investigate the potential mechanism of action of SIGLEC11 in GC. Macrophage polarization is a complex process regulated by multiple factors and signaling molecules. Our study validated the crucial role of the AKT/mTOR pathway in promoting M2 macrophage polarization by SIGLEC11 (figure 7). However, the specific interaction between SIGLEC11 and this pathway requires further investigation. A limitation of this study is the absence of functional SIGLEC11 homologous genes in mice, hindering the simulation of human immune environments and physiological pathological states in mice. Furthermore, in the microenvironment of GC, the ratio of monocytes to macrophages is dynamic and influenced by multiple factors. Early studies found that in GC tissues, an increase in monocyte infiltration correlates with a higher proportion of monocytes differentiating into macrophages, but a precise fixed range for this ratio is difficult to determine. Therefore, how to explain the high expression of SIGLEC11 in GC tissues needs to be supported by more data. Additionally, the association between high SIGLEC11 expression in M2 macrophages and worse survival has not been fully elucidated owing to the lack of public single-cell databases with survival information and the challenges in collecting samples with survival data for single-cell sequencing in a short time. Therefore, more appropriate methods need to be explored to explain this in future studies on SIGLEC11.

Graphical illustration of the mechanism. SIGLEC11 is upregulated in TAMs. Overexpression of SIGLEC11 promotes the polarization of macrophages to M2 phenotype by promoting the phosphorylation of AKT–mTOR pathway in macrophages and regulating the secretion of macrophages cytokines. Alterations of these immune regulatory elements caused by TAMs play a vital role in immunosuppression. SIGLEC, sialic acid-binding immunoglobulin-like lectin; TAMs, tumor-associated macrophages.
Recently, substantial preclinical data have shown that SA glycans–SIGLEC immune checkpoints can be used as a novel approach for cancer treatment.17 31 One such strategy involves targeting SIGLEC receptors, which can block inhibitory SIGLEC receptors, thereby supporting the repolarization of protumor macrophages in immunosuppressive microenvironments and increasing the phagocytic activity of antitumor macrophages.32 This provides a basis for further investigation into the clinical feasibility of SIGLEC11 immune checkpoint inhibitors.
Overall, this study revealed a distinct subset of TAMs in GC that expressed SIGLEC11, exhibited a protumor phenotype, and facilitated immune evasion. Further investigation of the potential of SIGLEC11 TAMs as therapeutic targets is a promising avenue for future studies on GC treatment.
Supplemental material
Data availability statement
Data are available upon reasonable request.
Ethics statements
Patient consent for publication
Ethics approval
All procedures involving pathological sample usage were according to the guidelines of the Ethics Review Board of Ruijin Hospital. All animal procedures were approved by Phenotek Biotechnology (Shanghai) Company, and in conformity to the Guide for Care and Use of Laboratory Animals (AUP-20240718-01).
References
Footnotes
JY, YangL and YihaoL contributed equally.
Contributors JY performed the acquisition of data, interpretation of data, statistical analysis, and drafting of the manuscript. YangL, YihaoL, QS provided technical and material support. MS, ZZ, DF, ZW and CL for study concept and design, analysis and interpretation of data, drafting of the manuscript, obtaining funding, and study supervision. All authors read and approved the final manuscript. CL was responsible for the overall content as the guarantor.
Funding This work was supported by the National Natural Science Foundation of China Grant NO.82173222 and NO.82373348.
Competing interests No, there are no competing interests.
Provenance and peer review Not commissioned; externally peer reviewed.
Supplemental material This content has been supplied by the author(s). It has not been vetted by BMJ Publishing Group Limited (BMJ) and may not have been peer-reviewed. Any opinions or recommendations discussed are solely those of the author(s) and are not endorsed by BMJ. BMJ disclaims all liability and responsibility arising from any reliance placed on the content. Where the content includes any translated material, BMJ does not warrant the accuracy and reliability of the translations (including but not limited to local regulations, clinical guidelines, terminology, drug names and drug dosages), and is not responsible for any error and/or omissions arising from translation and adaptation or otherwise.