Article Text

Abstract
Background Gut microbiota can significantly alter the risk or progression of cancer by maintaining gut immune system homeostasis. However, the exact mechanism by which the gut microbiota and its metabolites influence colorectal tumorigenesis is unclear.
Methods The roles of tryptophan metabolite indole-3-acetic acid (IAA) in inflammation and tumor development were investigated in dextran sodium sulfate (DSS) and azoxymethane (AOM)-DSS mouse models with or without IAA supplementation and with or without Lactobacillus reuteri-produced IAA. Pregnane X receptor (PXR) knockout (KO) mice and aryl hydrocarbon receptor KO mice were used to explore the mechanism by which IAA regulates interleukin (IL)-35 expression. IL-35+ immune cells were stimulated in vitro and analyzed by flow cytometry. Additionally, metabolites were analyzed by liquid chromatography-mass spectrometry.
Results We found that IAA, a metabolite of tryptophan produced in the gut by L. reuteri, can inhibit the development of colitis by inducing IL-35 expression in immunosuppressant cells. HuREG3αIECtg mice had high levels of intestinal microbiota-derived IAA, and these mice were resistant to AOM-DSS-induced cancer. Patients with colorectal cancer also had low peripheral blood levels of IAA. Further studies revealed that IAA-producing L. reuteri alleviated colitis symptoms and inhibited colon tumors by inducing macrophages, T cells, and B cells to produce IL-35. Finally, PXR KO completely abolished the effects of IAA on immune cells.
Conclusion We demonstrate that gut microbiota-derived IAA can improve the precancerous colon inflammatory environment through IL-35, thereby inhibiting tumorigenesis, suggesting that IAA may be a preventive factor for colitis-related cancers.
- Immunosuppression
- Colorectal Cancer
- Immune modulatory
- Macrophage
Data availability statement
Data are available upon reasonable request.
This is an open access article distributed in accordance with the Creative Commons Attribution Non Commercial (CC BY-NC 4.0) license, which permits others to distribute, remix, adapt, build upon this work non-commercially, and license their derivative works on different terms, provided the original work is properly cited, appropriate credit is given, any changes made indicated, and the use is non-commercial. See http://creativecommons.org/licenses/by-nc/4.0/.
Statistics from Altmetric.com
WHAT IS ALREADY KNOWN ON THIS TOPIC
Chronic inflammation such as inflammatory bowel disease (IBD) increases the risk of colorectal cancer in mice and humans.
The gut microbiota significantly regulates inflammation, thereby altering the risk or progression of cancer. However, the exact mechanism by which the gut microbiota and its metabolites influence colorectal tumorigenesis remains unclear.
WHAT THIS STUDY ADDS
Indole-3-acetic acid (IAA), a tryptophan metabolite of Lactobacillus reuteri, inhibits the development of colitis cancer.
IAA producing L. reuteri induces interleukin-35 production in macrophages, T cells and B cells, alleviates colitis symptoms and inhibits colon tumorigenesis.
The level of IAA in peripheral blood of patients with colorectal cancer is lower.
HOW THIS STUDY MIGHT AFFECT RESEARCH, PRACTICE OR POLICY
IAA derived from gut microbiota can inhibit tumorigenesis, suggesting that IAA may be a preventive factor for colitis-related cancer.
Background
Colorectal cancer (CRC) is a common malignancy of the gastrointestinal tract.1 The etiology and pathogenesis of CRC2 are based mainly on the accumulation of known genetic mutations in the colon epithelial cell genome.3 However, there is growing evidence that chronic inflammation, such as inflammatory bowel disease (IBD), can increase the risk of CRC in mice and humans.3–6 In fact, many chronic inflammatory diseases of the gastrointestinal tract are associated with an increased risk of tumors.7 For example, chronic inflammation can accelerate the transformation of intestinal epithelial cells (IECs) into tumor cells.8 Notably, the gut microbiota has been shown to play a key role in maintaining gut immune system homeostasis, which can significantly alter the risk for or progression of CRC.2 9–11 However, the exact mechanism by which the gut microbiota and its metabolites influence colorectal tumorigenesis remains unclear.
Chronic intestinal inflammation is regulated by the immune system. Different types of immunosuppressive cells, such as tolerant macrophages, regulatory T cells (Tregs), regulatory B cells (Bregs), and cytokines, including interleukin-35 (IL-35), play key roles in maintaining intestinal immune homeostasis. IL-35, a member of the IL-12 family, is a heterodimer composed of p35 (IL-12A) and Ebi3 (Epstein-Barr virus inducible gene 3).12 It has shown strong immunosuppressive effects both in vivo and in vitro.12–14 IL-35 is expressed in macrophages, T cells, B cells and other immune cells and can promote the production of Tregs and anti-inflammatory M2 macrophages15 16 and hinder the differentiation of Th1 cells.17 18 Notably, IL-35 can also directly promote self-expression in immune cells through certain receptors.19 20 Studies have shown that IL-35-producing Tregs and Bregs are key regulators of immunity during autoimmune and infectious diseases.21–24 IL-35−/− (Ebi3−/− and p35−/−) mice have been shown to be more sensitive to colitis.25 26 Furthermore, prophylactic delivery of IL-35 by Lactococcus lactis improves dextran sodium sulfate (DSS)-induced colitis in mice.27 28
The gut microbiota, including bacteria, archaea, fungi, viruses and phages, contributes to the regulation of the host immune response and gut homeostasis.29 30 For example, Akkermansia, 31 Bifidobacterium, 32 and Lactobacillus 33 are essential in the regulation of the intestinal immune response. Alterations in the gut microbiota have been found in many immune-related diseases, such as CRC.34 Indeed, the gut microbiota, and particularly its metabolites, has been shown to significantly affect cancer risk or progression.2 9 A lack of or reduction in health-beneficial bacteria, such as Lactobacillus, Clostridium, Streptococcus, Streptococcus and Carnobacterium, has been reported in patients with CRC.35 36 Additionally, evidence has also indicated that Lactobacillus can be used clinically as a supplement for the prevention and treatment of CRC to reduce the occurrence of this disease.37 Experimental studies have shown that tryptophan (Trp) metabolism could play a role in the development of several chronic diseases, including CRC.38 Trp metabolites influence tumor growth and metastasis through multiple mechanisms, including immune evasion, angiogenesis promotion, and drug resistance enhancement.39 For example, Bifidobacterium breve-derived indole-3-lactic acid (ILA) can modulate colitis-associated tumorigenesis by directing the differentiation of immature macrophages in the colon.40 In this study, we found that the serum levels of the Trp metabolite indole-3-acetic acid (IAA) were lower in patients with CRC. However, human REG3α transgenic (huREG3αIECtg ) mice that are resistant to azoxymethane (AOM)-DSS-mediated colon cancer have increased serum IAA levels. Further studies demonstrated that gut microbiota-derived IAA could inhibit the occurrence of colorectal tumors by reducing the inflammatory response in the colon through IL-35+ cells. Thus, our data suggest that gut microbiota-derived IAA improves the precancerous inflammatory colon environment through IL-35, thereby inhibiting tumorigenesis.
Methods
The reagents used in this study are listed in online supplemental table S1.
Supplemental material
Mice
4–6 week-old male and female C57BL/6 mice were obtained from Nanjing Animal Center, Nanjing, China. Aryl hydrocarbon receptor (AhR) knockout (KO) mice were obtained from the Third Military Medical University, Chongqing, China, whereas pregnane X receptor (PXR) KO mice were obtained from the Chinese Academy of Inspection and Quarantine, Tianjin, China. We generated huREG4IECtg mice.41
HuREG3αIECtg mice were generated by Nanjing Animal Center. To generate gut epithelial cell transgenic (Tg) mice expressing human REG3α under the control of the HD5 promoter, human REG3α complementary DNA was subcloned and inserted into a vector containing two insulators to block other regulatory functions. The Tg plasmid was digested, and the resulting fragment was injected into fertilized oocytes of C57BL/6J mice at the Nanjing Biomedical Research Institute of Nanjing University. The zygotes were subsequently transferred into the oviducts of pseudopregnant ICR female mice at 0.5 dpc. F0 mice were birthed 19~21 days after transplantation. There were no differences in the phenotypes of the huREG3αIECtg and control mice.
All the mice were bred and maintained under specific pathogen-free conditions at Nankai University. Experiments were carried out using age-matched and sex-matched mice. The procedures were conducted according to the Institutional Animal Care and Use Committee of the Model Animal Research Center.
Mouse models
DSS-induced colitis: Colitis was induced by DSS administration according to a previously reported method.42 Briefly, mice (15 mice per group) received 2.5% (w/v) DSS in their drinking water for 7 days and were then given regular drinking water. The amount of DSS water consumed per animal was recorded, and no differences in intake between strains were observed. The mice were weighed every other day to determine the per cent weight change, which was calculated as follows: % weight change = (weight on day X − day 0 / weight on day 0) × 100. The animals were also monitored clinically for rectal bleeding, diarrhea, and general signs of morbidity, including a hunched posture and failure to groom. In the survival studies, the mice were followed for 12 days after DSS treatment. The Disease Activity Index (DAI) was calculated, and the histological evaluation was performed according to previously reported methods.43 44 Briefly, the DAI was calculated as the average of the combined score of stool consistency, bleeding and weight loss divided by 3. Diarrhea was scored daily as follows: 0, normal; 2, loose stools; and 4, watery diarrhea. Blood in the stool was scored as follows: 0, normal; 2, slight bleeding; and 4, gross bleeding. Weight loss was scored as follows: 0, none; 1, 1–5%; 2, 5–10%; 3, 10–15%; and 4, >15%. The colons were removed, flushed carefully with phosphate-buffered saline (PBS), cut longitudinally and fixed flat in 4% paraformaldehyde overnight. Representative colon tissues were embedded in paraffin for H&E staining. Histological analysis was carried out on H&E-stained colon tissues. Histological scoring was as follows: epithelium (E): 0, normal morphology; 1, loss of goblet cells; 2, loss of goblet cells in large areas; 3, loss of crypts; 4, loss of crypts in large areas; and infiltration (I): 0, no infiltrate; 1, infiltrate around the crypt bases; 2, infiltrate reaching the lamina (L) muscularis mucosae; 3, extensive infiltration reaching the L muscularis mucosae and thickening of the mucosa with abundant edema; and 4, infiltration of the L submucosa. The total histological score was calculated as E + I.
Induction of tumorigenesis: The tumorigenesis procedure was performed according to a reported method.42 Briefly, 7–8 week-old mice (15 mice per group) were injected with AOM dissolved in 0.9% NaCl intraperitoneally at a dose of 12.5 mg/kg body weight and then challenged with three cycles of 1.5% (w/v) DSS in the drinking water for 6 days. The first cycle began immediately after AOM injection, followed by a recovery period with normal drinking water for 2 weeks before the second cycle was initiated. 2 weeks after the final DSS treatment, the mice were sacrificed. All of the colon tumors analyses were conducted under a stereomicroscope.
Lactobacillus transplantation: Lactobacillus transplantation was performed according to a previously reported method.41 Briefly, Lactobacillus reuteri was cultured in MRS media and harvested in the exponential phase. The cells were subsequently centrifuged at 2,500×g for 4 min, after which the bacterial pellets were resuspended in sterile MRS media for animal feeding. 6–8 week-old antibiotics (ABX) mice were treated with pan-antibiotics (ampicillin (A; 1 g/L, Sigma), vancomycin (V; 0.5 g/L, Sigma), neomycin sulfate (N; 1 g/L, Sigma), and metronidazole (M; 1 g/L, Sigma)) via their drinking water, which was changed every 3 days. Stool was collected from antibiotic-treated and untreated mice and cultured under anaerobic and aerobic conditions to confirm bacterial elimination. Then, 1×10⁹ bacteria were suspended in 1 mL of PBS with 30% glycerol. The mice were removed from the isolator and orally administered 200 mL of the glycerol stock containing bacteria (2×10⁸).
In vivo administration of IAA: Mice were treated by oral gavage with IAA sodium salt (500 mg/kg) dissolved in PBS every day for seven consecutive days, after which other experiments were performed.
In vivo administration of neutralizing antibodies: 100 µL of neutralizing anti-IL-35 blocking antibody (100 µg/mL) or rIL-35 (2.5 µg/mL) suspended in PBS was injected subcutaneously into the mice at the indicated times. In addition, control group mice were injected with an isotypic antibody (IgG1, 100 µg/mL).45
Preparation of chimeric mice: Recipient mice were irradiated with a single dose of 8 Gy of irradiation using a Shepherd Mark I cesium irradiator (J L Shepherd and Associates). Then, bone marrow cells (BMCs) collected from wild-type (WT) and PXR-KO mice46 were subsequently injected into the irradiated WT or PXR-KO recipient mice (2×10⁶ cells per mouse) via the tail vein.
Human samples
Blood samples from patients and healthy individuals (10 mL) were obtained from Tianjin Union Medical Center and Tianjin First Central Hospital. Participants were recruited from the health screening centers of Tianjin Union Medical Center and Tianjin First Central Hospital. Patient information is shown in online supplemental table S2.
Ex vivo stimulation
For ex vivo stimulation, mouse spleen cells or BMCs were collected. The CD4+ T cells and CD19+ B cells were subsequently isolated from mouse spleens, whereas CD11b+ monocytes/macrophages were isolated from BMCs. The isolated cells were seeded into a 24-well plate (5×10⁶ cells per well) and stimulated with IAA (100 µM), lipopolysaccharide (LPS) (100 ng/mL), or IAA (100 µM) plus LPS (100 ng/mL).
Cell isolation and flow cytometry
Cell isolation and flow cytometry were performed according to previous protocols.41 Briefly, for lamina propria (LP) lymphocyte staining, the mice were euthanized with carbon dioxide, and then the colons were removed and transferred immediately to laboratory tissue paper soaked liberally in PBS (without calcium or magnesium at room temperature). The colons were then opened longitudinally and washed vigorously to remove the contents via agitation in a Petri dish filled with PBS. Fine forceps were used to gently squeeze out any remaining mucus, after which the colon tissues were cut into 1 cm pieces. The pieces were collected and transferred to a 50 mL centrifuge tube containing 30 mL of PBS supplemented with 10% fetal bovine serum (FBS) on ice. The samples were washed by adding 30 mL of prewarmed PBS, transferred to tubes containing 15 mL of 2 mM EDTA in PBS, and warmed to 37°C. The samples were then shaken vigorously by hand and placed in an orbital shaker for 15 min. After shaking, the samples were poured onto Nitex mesh and washed with unsupplemented PB. The colon pieces were subsequently transferred into 15 mL of digestion buffer (Dulbecco’s Modified Eagle Medium (DMEM) supplemented with 5% FBS, 1 mg/mL collagenase IV (Sigma-Aldrich) and DNase I (Sigma-Aldrich)) for 40 min of incubation. After the digestion, enzyme activity was rapidly terminated by the addition of 35 mL of ice-cold DMEM. The digested tissues were filtered through a 40 mm filter, collected and centrifuged at 400×g for 10 min at 4°C to pellet the isolated cells. The cells were resuspended in 10 mL of the 40% fraction of a 40:80 Percoll gradient and overlaid on 5 mL of the 80% fraction in a 15 mL Falcon tube. Percoll gradient separation was performed by centrifugation at 1,800 rpm for 20 min at room temperature. LP lymphocytes were collected at the interphase of the Percoll gradient, washed, resuspended in medium, stained and analyzed by flow cytometry.
Different immune cell populations were washed with staining buffer containing PBS, 2% FBS, 1 mM EDTA and 0.09% NaN3, and surface staining was performed with FITC-labeled, PE-labeled, APC-labeled, or PercP/Cy5.5-labeled anti-CD45, CD4, CD11b, and CD19 antibodies before analysis with a FACScan flow cytometer.47 Dead cells were identified by 7-Amino-Actinomycin D staining.
For intracellular staining, the cells were cultured and stimulated for 6 hours with 50 ng/mL phorbol 12-myristate 13-acetate and 1 µg/mL ionomycin in the presence of GolgiStop. After incubation, the cells were washed with PBS, fixed in Cytofix/Cytoperm, permeabilized with Perm/Wash buffer (BD Biosciences), and stained with FITC-conjugated, PE-conjugated, APC-conjugated or PerCP/Cy5.5-conjugated anti-Ebi, p35, Foxp3 and IFN-γ antibodies. Dead cells were identified by 7-AAD staining.
Analysis of the gut microbiota
The gut microbiota analyses were performed according to a previous protocol.41 Briefly, the gut microbiota was analyzed by Majorbio Biotechnology Company (Shanghai, China) using primers that target the V3-V4 regions of 16S rRNA. Once PCR for each sample was completed, and the amplicons were purified using the QIAquick PCR purification kit (Qiagen Valencia, California, USA), quantified, normalized, and then pooled in preparation for emulsion PCR followed by sequencing via titanium chemistry (Roche, Basel Switzerland) according to the manufacturer’s protocol. Operational taxonomic unit (OTU) analysis was performed as follows: sequences were processed (trimmed) using Mothur software and subsequently clustered at 97% sequence identity using CD-HIT to generate OTUs, which were used to construct sample—OTU count matrices. The samples were clustered at the genus and OTU levels using the sample—genus and sample—OTU count matrices, respectively. For each cluster, Morisita-Horn dissimilarity was used to compute a sample distance matrix from the initial count matrix, and the distance matrix was subsequently used for hierarchical clustering using Ward’s minimum variance method. The Wilcoxon rank-sum test was used to identify OTUs that were differentially abundant among the different sample groups.
Liquid chromatography-tandem mass spectrometry
Peripheral blood was drawn from patients and healthy individuals at the indicated time points for serum metabolite measurements. The blood was allowed to clot for 30 min and then centrifuged (1,000×g) for 10 min and stored at −20°C. Serum was diluted and used. The samples were subjected to liquid chromatography-tandem mass spectrometry (LC-MS/MS) analysis according to our previously reported method.41 Kyoto Encyclopedia of Genes and Genomes (KEGG) (http://www.genome.jp/kegg/) and MetaboAnalyst (http://www.metaboanalyst.ca/) were subsequently used for pathway enrichment analysis.
Statistical analyses
Unpaired Student’s test and two-way analysis of variance test were used to determine significance. The statistical significance of the survival curves was estimated using the log-rank (Mantel-Cox) test. A 95% CI was considered significant.
Results
HuREG3αIECtg mice are resistant to AOM-DSS-mediated colitis cancer
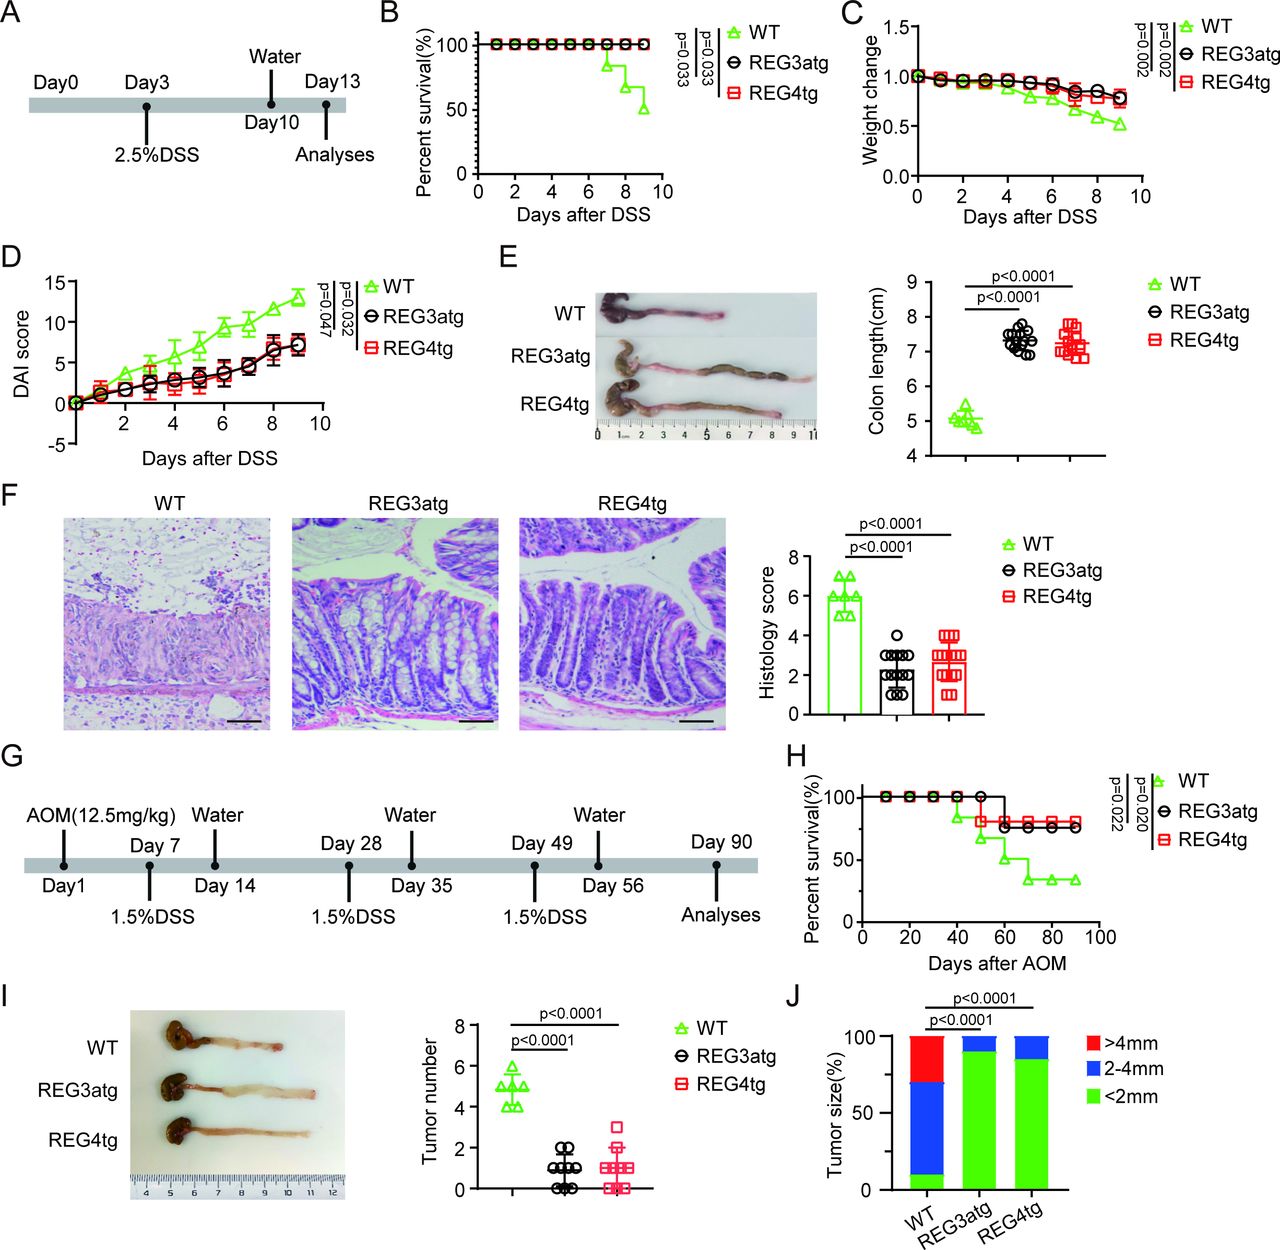
Human C-type lectin regenerating family member 3α (REG3α) is present in the mucosa of the intestine and colon48 49 and can be detected in the colonic deep crypt regions.48 Previous studies showed that human REG3α could control inflammation in mice with colitis on intestinal administration.50 However, recent studies have also shown that patients with IBD secrete higher levels of REG3 protein.51 To further determine the role of REG3α derived from human intestinal epithelial cells in colitis, we constructed human REG3α intestinal epithelial cell transgenic (huREG3αIECtg ) mice. Compared with the control group, these huREG3αIECtg mice presented significant resistance to DSS-induced colitis (figure 1A–F), which was consistent with previous results.50 Indeed, after 7 days of exposure to 2.5% DSS in the drinking water, the huREG3αIECtg mice had increased survival rates, greater body weights, lower DAIs and longer colon lengths (figure 1B–E), indicating less inflammation. H&E staining also revealed that huREG3αIECtg colon sections presented less inflammatory infiltration and lower histological scores (figure 1F). Interestingly, huREG3αIECtg mice are similar to huREG4IECtg mice (figure 1B–F), which have been shown to resist inflammation, in terms of sensitivity to DSS-induced colitis.44

HuREG3αIECtg mice are resistant to AOM-DSS-mediated colitis carcinoma. (A) Schematic diagram of DSS-induced colitis model in huREG3αIECtg (REG3atg), huREG4IECtg (REG4tg) and their control (WT) mice. Mice were exposed to 2.5% DSS for 7 days, and followed by regular water for 3 days. (B) Survival rates of the mice in indicated groups, n=15 mice (7–8 weeks, male)/group. (C–D) Body weight changes (C) and Disease Activity Index (D) in the indicated groups after DSS (WT, n=7; REG3atg, n=15; REG4tg, n=15). (E) Representative colon images and statistical analysis of colon length in the indicated groups (WT, n=7; REG3atg, n=15; REG4tg, n=15). (F) Representative H&E staining images and histological analysis of the colon tissues from the indicated groups (WT, n=7; REG3atg, n=15; REG4tg, n=15); scale bar=45 µm. (G) Schematic diagram of the experimental design for the AOM-DSS-induced colitis cancer model; After the initial AOM injection (12.5 mg/kg), three cycles of 1.5% DSS were administered to mice in drinking water. (H) Survival rates of the mice in indicated groups, n=15 mice (7–8 weeks, male)/group. (I) Representative images and statistical analysis of colon tumor numbers in the indicated groups (WT, n=6; REG3atg, n=9; REG4tg, n=9). (J) Tumor size distribution in the indicated groups (WT, n=6; REG3atg, n=9; REG4tg, n=9). Error bars indicate mean±SD (C–E and I) or mean±SEM (F). Statistic test: two-way analysis of variance test (C and D); unpaired Student’s t-test (E–F and I); log-rank (Mantel-Cox) test (B and H); Fisher’s exact test (J). Data were representative of three experiments. AOM, azoxymethane; DSS, dextran sulfate sodium; WT, wild-type.
Chronic inflammatory disorders of the gastrointestinal tract are associated with increased neoplastic risk.7 Such conditions can accelerate the transformation of IECs into tumor cells.8 We next used huREG3αIECtg mice to investigate whether REG3α in human gut epithelial cells affects the occurrence and development of colitis-associated carcinomas by establishing an AOM-DSS model.52 HuREG3αIECtg and control mice were injected with AOM and then challenged with DSS. Interestingly, huREG3αIECtg mice effectively resisted colon cancer occurrence and development (figure 1G–J). The huREG3αIECtg mice not only had a higher survival rate (figure 1H) but also fewer tumors than the control mice did (figure 1I,J). Notably, similar resistance to AOM-DSS-mediated colitis cancer was detected in huREG3αIECtg mice and huREG4IECtg mice (figure 1G–J). Thus, our data suggest that REG3α from human gut epithelial cells is involved in the development and occurrence of colitis-induced carcinoma.
Gut microbiota-derived IAA maintains gut homeostasis
The gut microbiota can be affected by gut epithelial cell-derived bactericidal substances such as C-type lectins.50 Deficiencies in intestinal C-type lectins can lead to dysbiosis of the gut microbiota to promote the development of IBD.50 C-type lectins may bind to bacteria and induce damage to the bacterial cell wall53 and potentially affect the composition of the gut microbiota.54 Since huREG3αIECtg and huREG4IECtg mice exhibit similar resistance to AOM-DSS-mediated colitis cancer, they may have a similar gut microbiota composition. Indeed, similar to huREG4IECtg mice,41 huREG3αIECtg mice presented changes in the composition of the gut microbiota, such as a markedly increased proportion of Lactobacillus (figure 2A).41 44 Since previous reports have shown that Lactobacillus can produce IAA,55 56 we detected the levels of IAA in huREG3αIECtg mice. There were increased levels of IAA not only in the colon stools but also in the peripheral blood of huREG3αIECtg mice, similar to huREG4IECtg mice, which also presented high levels of IAA44 (figure 2B,C). Thus, we next determined whether REG3α mediated resistance to DSS-mediated colitis through IAA. The mice were treated by oral gavage with IAA sodium salt dissolved in PBS every day for seven consecutive days and then fed 2.5% DSS in the drinking water. The IAA-treated mice had higher survival rates, heavier body weights, lower DAIs and longer colon lengths (figure 2D–H), suggesting their resistance to DSS-induced colitis. H&E staining also revealed less inflammatory infiltration and lower histological scores in the colon histological sections of these mice (figure 2I). Thus, gut microbiota-derived IAA can resist DSS-mediated colitis and play an important role in maintaining gut homeostasis.

Resistance of huREG3αIECtg mice to DSS-mediated colitis is through gut microbiota derived IAA. (A) 16S rRNA analyses of the gut microbiota in huREG3αIECtg (REG3a), huREG4IECtg (Reg4) and their control mice (WT); each sample was a pooled sample from six mice. (B and C) Analyses of the IAA contents in the stool (B) and serum (C) of the indicated groups. (D) Schematic diagram of the experimental design for determining the effect of IAA on DSS-mediated colitis. Mice were treated with IAA via gavage daily for 7 days before exposure to 2.5% DSS. (E) Survival rates of the mice treated with or without IAA, n=15 mice (7–8 weeks, male)/group. (F–G) Body weight changes (F) and Disease Activity Index (G) of the mice treated with IAA or PBS after DSS (PBS, n=7; IAA, n=10). (H) Representative colon images and statistical analysis of colon length in mice treated with IAA or PBS (WT, n=6; PBS, n=7; IAA, n=10). WT, control mice without DSS; (I) Representative H&E staining images and histological analysis of colon tissues from the mice treated with IAA or PBS (WT, n=6; PBS, n=7; IAA, n=10). WT, control mice without DSS; scale bar=45 µm. (J) Flow cytometry analyses of CD45+ F4/80+Ebi3+P35+ cells in the colon tissues of mice treated with IAA or PBS. (K) Flow cytometry analyses of CD45+CD4+IFN-γ+ cells in the colon tissues of mice treated with IAA or PBS. (L–M) Concentration of IL-35 (L) and IAA (M) in the stool of mice treated with IAA or PBS. Error bars indicate mean±SD (B, C, F–H and J–M) or mean±SEM (I). Statistic test: two-way analysis of variance test (F and G); unpaired Student’s t-test (B, C and H–M): log-rank (Mantel-Cox) test (E). Data were representative of three experiments. DSS, dextran sulfate sodium; IAA, indole-3-acidic acid; IEC, intestinal epithelial cell; IFN, interferon; PBS, phosphate-buffered saline; WT, wild-type.
Gut microbiota-derived IAA promotes the generation of IL-35
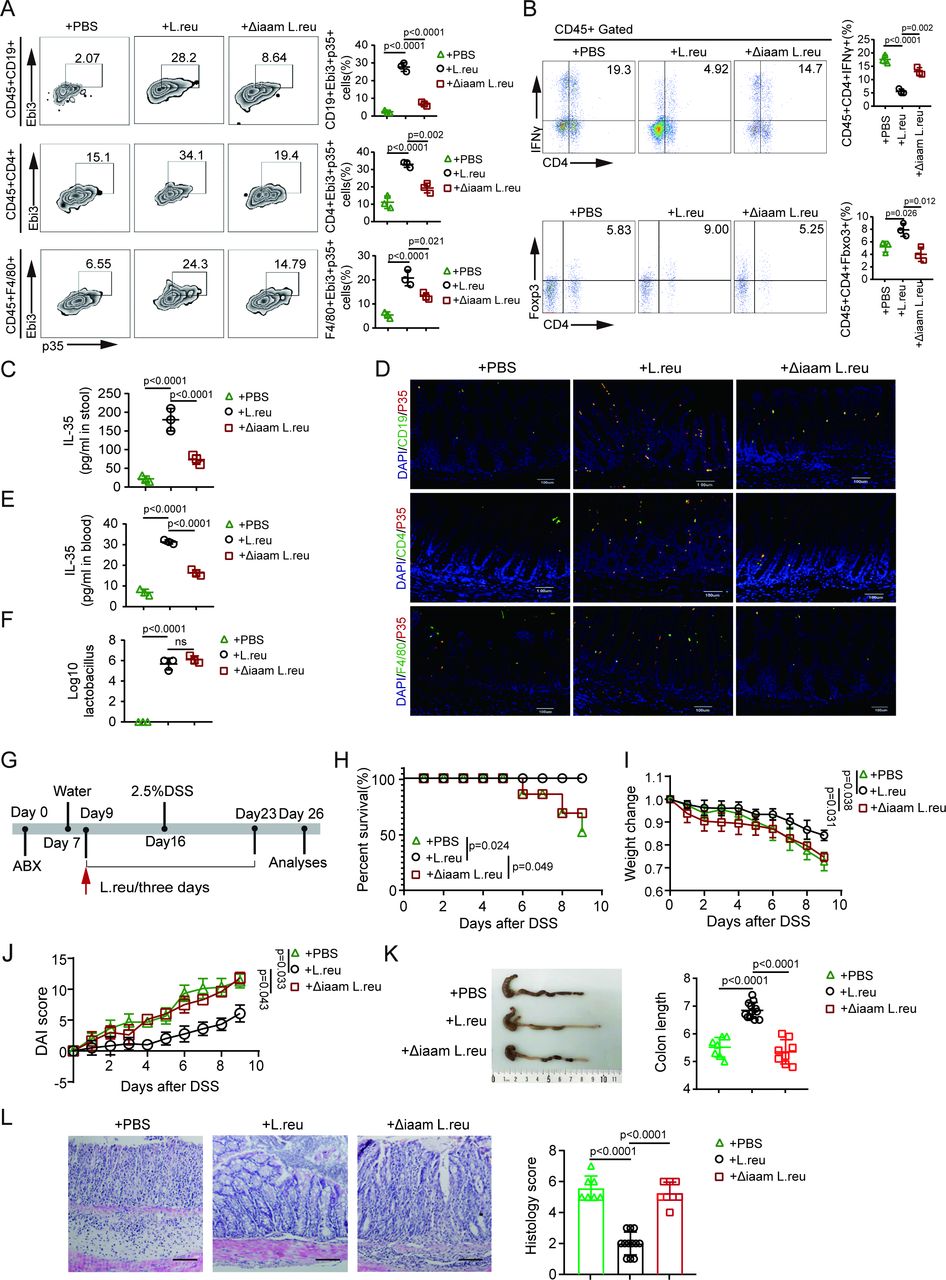
We next analyzed the immune cells of the mice treated by oral gavage with IAA sodium salt. The data revealed not only high levels of IL-35 in colon tissues but also increased numbers of IL-35+ macrophages, IL-35+ B cells and IL-35+ CD4+ cells (figure 2J,L; online supplemental figure S1). Moreover, there was an increase in Tregs along with a reduction in Th1 cells (figure 2K; online supplemental figure S1). We next used the previously generated L. reuteri ΔiaaM strain, which cannot produce IAA, and L. reuteri, 44 which can produce IAA, to further investigate how IAA affects IL-35 induction in immune cells. We observed increases in the IL-35 levels in colon tissues and peripheral blood and the numbers of IL-35+ macrophages, IL-35+ T cells and IL-35+ B cells in the colons of L. reuteri-treated mice, whereas L. reuteri ΔiaaM gavage did not produce these effects (figure 3A,C–E; online supplemental figure S1). IL-35 can promote the generation of Tregs and impede the differentiation of Th1 cells.17 Indeed, there was also an increase in the number of CD4+Foxp3+ Tregs and a reduction in the number of CD4+IFN-γ+ Th1 cells in L. reuteri-treated mice but not in L. reuteri ΔiaaM -treated mice (figure 3B; online supplemental figure S1). Notably, there were almost equal numbers of lactobacilli in the colonic contents of L. reuteri-treated and L. reuteri ΔiaaM -treated mice (figure 3F). The data also revealed increased resistance to DSS-mediated colitis in ABX mice treated with L. reuteri compared with those treated with L. reuteri ΔiaaM via gavage. Furthermore, after similar treatments in ABX mice (treated with vancomycin, ampicillin, metronidazole, and neomycin), those mice gavaged with L. reuteri presented greater body weights, lower DAIs, longer colon lengths, less inflammatory infiltration and lower colon histological scores than those gavaged with L. reuteri ΔiaaM (figure 3G–L). Taken together, these findings indicate that gut microbiota-derived IAA promotes gut homeostasis by promoting the generation of IL-35+ immune cells.

Lactobacillus-derived IAA promotes IL-35 in immune cells. (A) Flow cytometry analyses of CD45+CD19+Ebi3+P35+, CD45+CD4+Ebi3+P35+ and CD45+F4/80+Ebi3+P35+ cells in the colon tissues of mice subjected to the indicated treatments. (B) Flow cytometry analyses of CD4+IFN-γ+ and CD4+Foxp3+ cells in the colon tissues of mice subjected to the indicated treatments. (C) Concentration of IL-35 in the stool of the indicated groups detected by ELISA. (D) Representative images of CD19+P35+, CD4+P35+ and F4/80+ P35+ cells in the colon tissues from indicated groups. Blue, DAPI. Scale bar=45 µm. (E) Concentration of IL-35 in the peripheral blood of the indicated groups. (F) Lactobacillus contents in the stool of the mice subjected to the indicated treatments. (G) Schematic diagram of the experimental design for evaluating the effects of IAA-producing L. reu on DSS-induced colitis. Mice were treated with ABX and then with L. reuteri (L. reu) or L. reuteri ΔiaaM (Δiaam L. reu) gavage 3 days later (once every 3 days) for 7 days. After gavage, the mice were exposed to 2.5% DSS. (H) Survival rates of the indicated groups, n=15 mice (7–8 weeks, male)/group; (I–J) Body weight changes (I) and Disease Activity Index (DAI) (J) in the indicated groups (PBS, n=7; L. reu, n=12; Δiaam L. reu, n=8); (K) Representative colon images and statistical analysis of the colon length in the indicated groups (PBS, n=7; L. reu, n=12; Δiaam L. reu, n=8); (L) Representative H&E staining images and histological analysis of the colon tissues from indicated groups (PBS, n=7; L. reu, n=12; Δiaam L. reu, n=8). Scale bar=45 µm. Error bars indicate mean±SD (A–C, E, F and I–K) or mean±SEM (L). Statistic test: two-way analysis of variance test (I–J); unpaired Student’s t-test (A–C, E, F and K–L); log-rank (Mantel-Cox) test (H). Data were representative of three experiments. ABX, antibiotics; DAPI, 4', 6-diamidino-2-phenylindole; DSS, dextran sulfate sodium; IAA, indole-3-acidic acid; IFN, interferon; IL, interleukin; L. reu, Lactobacillus reuteri; PBS, phosphate-buffered saline; Δiaam L. reu, iaaM deleted Lactobacillus reuteri.
IL-35 suppresses colitis-associated tumorigenesis
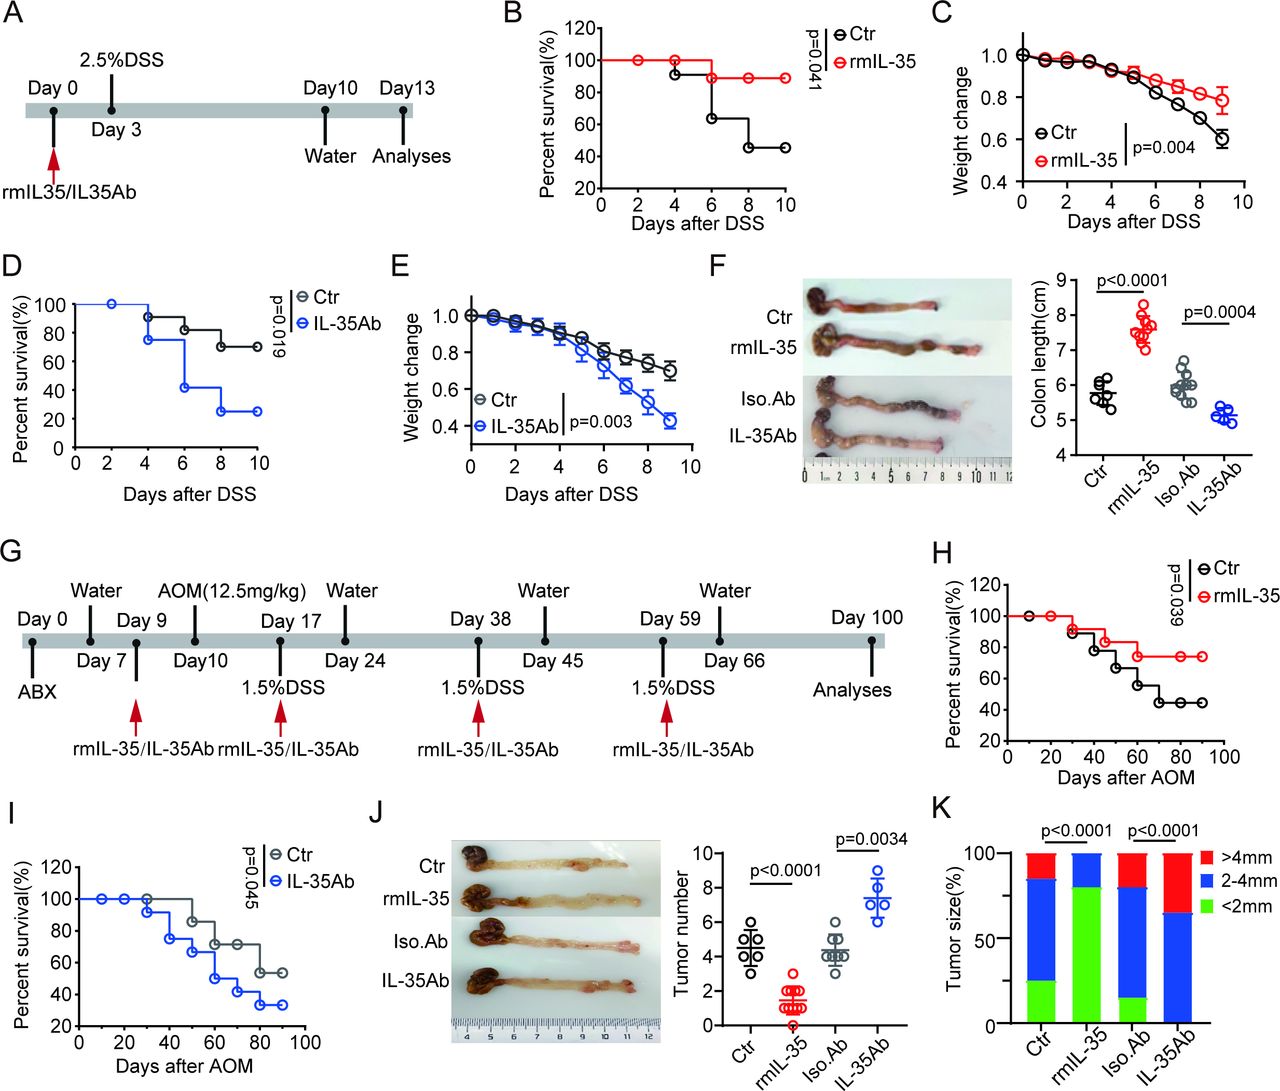
We next investigated the effects of IL-35 on the occurrence and development of CRC. Previous studies have shown that IL-35 can promote the development of tumors.45 57 However, few reports have also noted its contradictory role in cancer prevention.58 Thus, we employed recombinant mouse IL-35 (rmIL-35) and IL-35 neutralizing antibodies to further examine this phenomenon. We first determined whether IL-35 plays a role in the sensitivity of mice to DSS-induced colitis. The mice were injected with rmIL-35 or an anti-IL-35 neutralizing antibody before DSS ingestion, and the results showed that rIL-35 administration indeed reduced the sensitivity of the mice to DSS-induced colitis, as the survival rate, body weight and colon length were increased in these mice (figure 4A–F). However, IL-35 antibodies also increased the sensitivity of mice to DSS-mediated colitis (figure 4A–F), which is consistent with previous data.59

IL-35 inhibits colitis-associated tumorigenesis. (A) Schematic diagram of the experimental design for detecting the effects of IL-35 on DSS-induced colitis. Mice were treated with rmIL-35/IL-35Ab and then exposed to 2.5% DSS. (B) Survival rates of mice treated with rmIL-35 or Ctr (control, PBS), n=15 mice (7–8 weeks, male)/group. (C) Body weight changes were measured and recorded in mice treated with rmIL-35 (n=10) or Ctr (control, PBS, n=7) after DSS. (D) Survival rates of the mice treated with IL-35Ab or Iso.Ab (isotypic control), n=15 mice (7–8 weeks, male)/group. (E) Body weight changes of the mice treated with IL-35Ab (n=5) or Iso. Ab (isotypic control, n=11). (F) Representative colon images and statistical analysis of colon length in mice treated with or without rmIL-35/IL35Ab (Ctr (control, PBS), n=7; rmIL-35, n=10; Iso.Ab (isotypic control), n=11; IL-35Ab, n=5). (G) Schematic diagram of the experimental design for detecting the effects of IL-35 on DSS-induced colitis carcinoma. Mice were treated with rmIL-35/IL-35Ab before being injected with AOM and exposed to DSS. (H and I) Survival rates in the mice treated with or without rmIL-35/IL-35Ab, n=15 mice (7–8 weeks, male)/group. (J) Representative images and statistical analysis of colon tumors in the mice treated with or without rmIL-35/IL-35Ab (Ctr (control, PBS), n=6; rmIL-35, n=11; Iso.Ab (isotypic control), n=8, IL-35Ab, n=5). (K) Tumor size distribution in the mice treated with or without rmIL-35/IL-35Ab (Ctr (control, PBS), n=6; rmIL-35, n=11; Iso.Ab (isotypic control), n=8, IL-35Ab, n=5). Error bars indicate mean±SD (C, E, F and J). Statistic test: two-way analysis of variance test (C and E); unpaired Student’s t-test (F and J); log-rank (Mantel-Cox) test (B, D, H and I); Fisher’s exact test (K). Data were representative of three experiments. ABX, antibiotics; AOM, azoxymethane; DSS, dextran sulfate sodium; IL, interleukin; PBS, phosphate-buffered saline; rmIL, recombinant mouse IL.
We next employed an AOM-DSS-mediated colitis cancer model to investigate the effects of IL-35 on the occurrence and development of colon carcinomas. The mice were injected with AOM, challenged with DSS, and injected with rmIL-35 or IL-35 antibodies. The data showed that rIL-35 could effectively prevent the occurrence and development of colon cancer, as rIL-35-injected mice had a greater survival rate and fewer tumors than the control mice did (figure 4G–K), whereas the opposite results were observed in the IL-35 neutralizing antibody-injected mice (figure 4G–K). Notably, there was also a marked difference in the number of tumors in the rmIL-35 and IL-35 neutralizing antibody-treated mice compared with the control mice. The rmIL-35-treated mice had fewer tumors than the control mice did, whereas the IL-35 neutralizing antibody-treated mice had more (figure 4J). These results suggest that IL-35 can inhibit the occurrence and progression of cancer mediated by AOM-DSS.
IAA affects IL-35 through PXR in macrophages
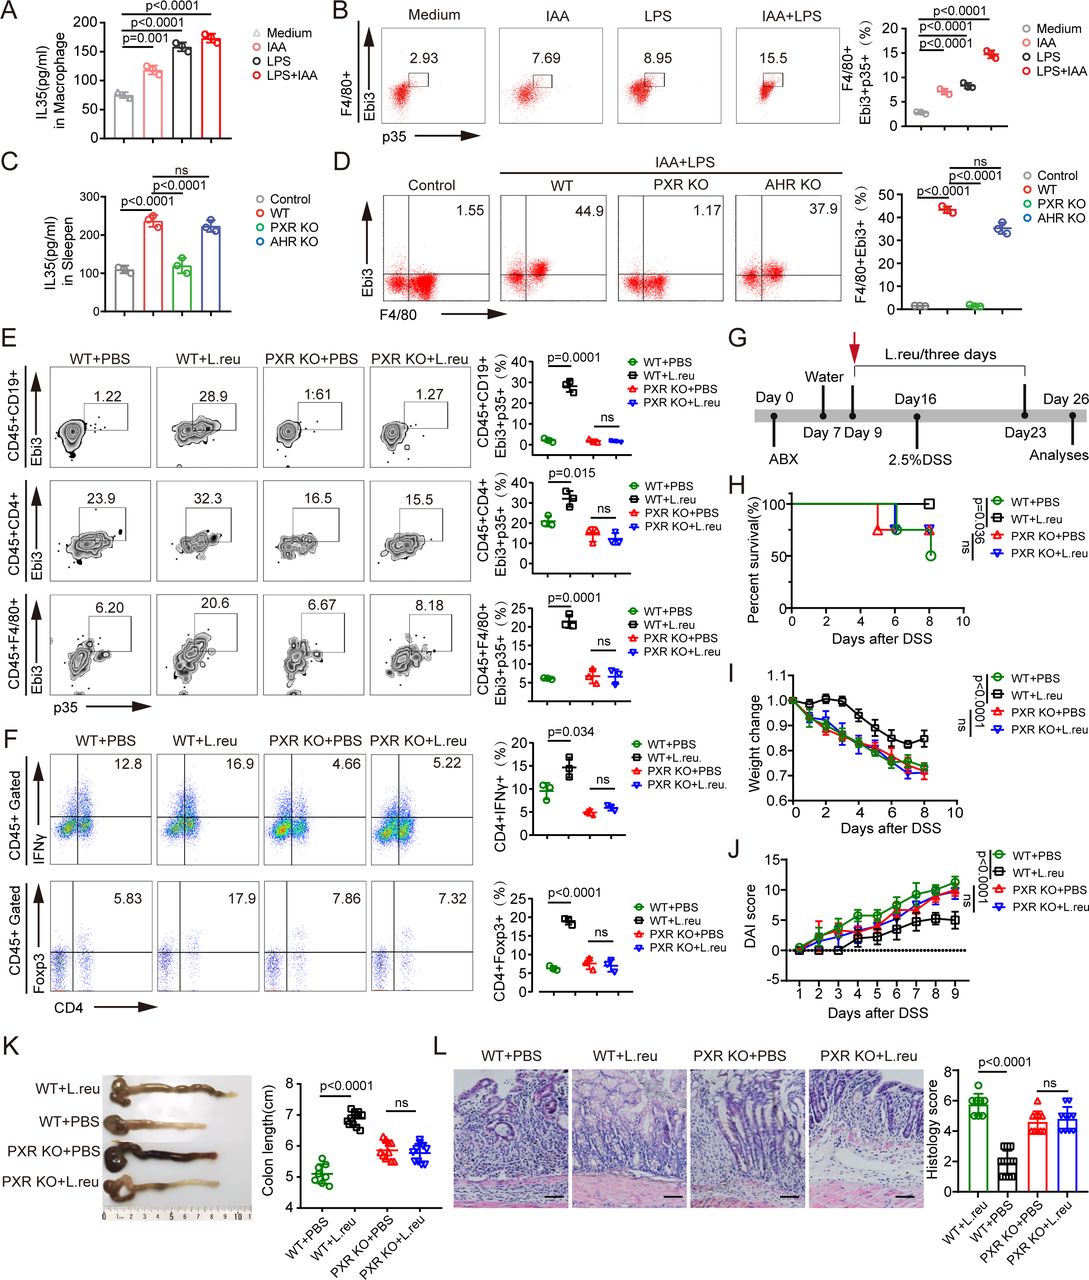
The increased numbers of IL-35+ macrophages, IL-35+ B cells and IL-35+ T cells in IAA-producing or IAA-producing L. reuteri-treated mice suggested that IAA could induce the expression of IL-35 in these immune cells. Thus, we first isolated macrophages from bone marrow cells, and B cells and T cells from mouse spleens for co-culture with IAA. The data revealed that IAA alone slightly induced the expression of IL-35 in macrophages and B cells but not in T cells (figures 2B and 5A; online supplemental figure S2). Previous reports have suggested that LPS, which is present in gram-negative bacteria in the gut, can induce the expression of IL-3541; thus, we added LPS to the co-culture. IAA together with LPS effectively induced IL-35 generation in macrophages (figure 5A,B). IAA combined with LPS also induced IL-35 in B cells (online supplemental figure S2), which is consistent with previous findings.41 However, IAA plus LPS did not induce IL-35 in T cells (online supplemental figure S2). The increased number of IL-35+ T cells in the colon tissues of IAA-treated mice could be due to the direct role of IL-35 in T cells, which can induce IL-35 expression.19 20 IAA is a potent bioactive metabolite that activates the transcription factors PXR and AhR.60 We then isolated macrophages from the bone marrow of WT, AhR-KO and PXR-KO mice and then exposed them to IAA and LPS. The data revealed that AhR-KO macrophages and IAA and LPS cotreated macrophages did not significantly differ in terms of IL-35 expression, whereas IAA and LPS cotreated PXR-KO macrophages exhibited a marked difference in IL-35 expression (figure 5C,D), suggesting that PXR plays a critical role in mediating IL-35 expression in macrophages. We next used PXR-KO mice to examine the in vivo induction of IL-35+ immune cells. PXR-KO and WT mice were treated with IAA-producing L. reuteri via gavage. The data revealed that L. reuteri effectively induced IL-35+ macrophages, B cells and T cells in WT mice but not in PXR-KO mice (figure 5E), suggesting that the induction of IL-35+ immune cells by IAA-producing L. reuteri is mediated by the transcription factor PXR, which is consistent with our previous data.41 Moreover, there were also more Tregs and fewer Th1 cells in WT mice after gavage with IAA-producing L. reuteri than those in PXR-KO mice (figure 5F). We also used a DSS-induced colitis model to investigate the involvement of the transcription factor PXR. WT mice gavaged with IAA-producing L. reuteri exhibited marked resistance to DSS-mediated colitis compared with WT mice without IAA-producing L. reuteri gavage, whereas there was no difference in colitis resistance between PXR-KO mice gavaged with or without IAA-producing L. reuteri (figure 5G–L).

IAA induces IL-35 in macrophages through PXR. (A–B) Concentration of IL-35 in the supernatants (A) of isolated monocytes/macrophages and flow cytometry of F4/80+Ebi3+P35+ cells (B) in isolated monocytes/macrophages after exposure to IAA (100 µM), LPS (100 ng/mL) or LPS (100 ng/mL)+IAA (100 µM) for 24 hours; medium, control. (C–D) Concentration of IL-35 in the supernatants (C) of isolated monocytes/macrophages and flow cytometry of F4/80+Ebi3+ cells (D) in isolated monocytes/macrophages from WT, PXR KO and AHR KO mice after exposure to LPS (100 ng/mL)+IAA (100 µM) for 24 hours; control, the supernatant of monocytes/macrophages without LPS+IAA treatment. (E) Flow cytometry analyses of CD45+F4/80+Ebi3+P35+, CD45+CD19+Ebi3+P35+ and CD45+CD4+Ebi3+P35+ cells in the PXR KO or control mice (WT) treated with or without L. reu gavage. (F) Flow cytometry analyses of CD45+CD4+IFN-γ+ and CD45+CD4+Foxp3+ cells in the PXR-KO or control mice (WT) treated with or without L. reu gavage. (G) Schematic diagram of the experimental design to evaluate L. reuteri treatment in a DSS-induced colitis mouse model. PXR-KO and WT mice were treated with ABX and then with L. reuteri (L. reu) or PBS gavage 3 days later (once every 3 days) for 7 days. After L. reu gavage, mice were exposed to 2.5% DSS. (H) Survival rates in the PXR KO or WT mice treated with L. reu or PBS gavage, n=15 mice (7–8 weeks, male)/group. (I–J) Body weight changes (I) and Disease Activity Index (J) were measured and recorded in the indicated groups after DSS (WT+PBS, n=8; WT+L. reu, n=12; PXR KO+PBS, n=10; PXR KO+L. reu, n=10). (K) Representative colon images and statistical analysis of colon length in the indicated groups (WT+PBS, n=8; WT+L. reu, n=12; PXR KO+PBS, n=10; PXR KO+L. reu, n=10). (L) Representative H&E staining images and histological analysis of colon tissues from indicated groups (WT+PBS, n=8; WT+L. reu, n=12; PXR KO+PBS, n=10; PXR KO+L. reu, n=10); scale bar=45 µm. Error bars indicate mean±SD (A–F and I–K) or mean±SEM (L). Statistic test: two-way analysis of variance test (I–J); unpaired Student’s t-test (A–F and K–L), log-rank (Mantel-Cox) test (H); Ns, no significance. Data were representative of three experiments. ABX, antibiotics; DSS, dextran sulfate sodium; AHR, aryl hydrocarbon receptor; IAA, indole-3-acidic acid; IFN, interferon; IL, interleukin; KO, knockout; LPS, lipopolysaccharide; L. reu, Lactobacillus reuteri; PBS, phosphate-buffered saline; PXR, pregnane X receptor; WT, wild-type.
To eliminate the involvement of PXR in gut epithelial cells, we established a chimeric mouse model by transplanting BMCs. 4 weeks after BMCs were transplanted from CD45.2+ PXR-KO to CD45.1+ WT mice, markedly fewer IL-35+ macrophages, T cells and B cells were present in the colon tissues of PXR KO mice after IAA-producing L. reuteri gavage (online supplemental figure S3A), whereas there were no differences in WT mice transplanted with PXR-KO BMCs or PXR-KO mice transplanted with PXR-KO BMCs, suggesting that the induction of IL-35+ immune cells via IAA-producing L. reuteri occurs through the transcription factor PXR. Moreover, there were also more Tregs and fewer Th1 cells in PXR-KO mice transplanted with WT BMCs than in WT mice transplanted with PXR-KO BMCs (online supplemental figure S3B). In addition, WT BMC-transplanted PXR-KO mice were much more resistant to DSS-mediated colitis than PXR-KO BMC-transplanted WT mice were (online supplemental figure S3C–I), whereas there was no difference between PXR-KO BMC-transplanted WT mice and PXR-KO BMC-transplanted PXR-KO mice (online supplemental figure S3C–I). Indeed, heavier body weights, lower DAIs, longer colon lengths, less inflammatory infiltration, and lower histological scores were detected in the colon histological sections of PXR-KO mice receiving WT BMCs and L. reuteri gavage than in PXR-KO mice receiving PXR-KO BMCs. These results suggest that only PXR in immune cells is involved in the IAA-mediated induction of IL-35.
Gut microbiota-derived IAA suppresses colitis-associated tumorigenesis
Since L. reuteri-treated mice can induce IL-35 generation in immune cells via IAA, we also detected the effects of IAA-producing L. reuteri on the occurrence and development of colitis cancer in these mice. The data revealed that L. reuteri-treated WT mice were less sensitive to AOM-DSS-mediated colitis cancer than L. reuteri ΔiaaM-treated mice were. The survival rate was higher, and the number of tumors was less in the IAA-producing L. reuteri-treated mice than in the L. reuteri ΔiaaM-treated mice (figure 6A–D). Notably, there was a markedly increased level of IAA in L. reuteri-treated mice compared with that in L. reuteri ΔiaaM-treated mice (figure 6E). Thus, IAA indeed can influence tumorigenesis.

IAA-producing L. reu inhibits tumorigenesis. (A) Schematic diagram of the experimental design for the AOM/DSS-induced model in mice treated with IAA-producing L. reuteri. Mice were treated with ABX and then with L. reuteri (L. reu) or L. reuteri ΔiaaM (Δiaam L. reu) gavage or PBS (once every 3 days) 3 days later for 7 days. After gavage, mice were treated with AOM injection (12.5 mg/kg) and then exposed to three cycles of 1.5% DSS in drinking water. (B) Survival analysis of mice in indicated groups, n=15 mice (7–8 weeks, male)/group. (C) Representative images and statistical analysis of colon tumors from the indicated groups (PBS, n=5; L. reu, n=10; Δiaam L. reu, n=5). (D) Histogram showing size distribution of tumors in the indicated group (PBS, n=5; L. reu, n=10; Δiaam L. reu, n=5). (E) Concentration of IAA in the stool of the mice with indicated treatment; (F) schematic diagram of the experimental design for the AOM-DSS model in chimera mice. Mice received 8 Gy irradiation and then were followed by transplantation of BMCs via tail vein injection. After 4 weeks, mice were treated with ABX, and then with L. reu gavage (once every 3 days). After gavage, the mice were treated with AOM injection (12.5 mg/kg) and then exposed to three cycles of 1.5% DSS in drinking water. (G) Survival curves in the chimera mice treated with L. reu (+L. reu); n=15 mice (7–8 weeks, male)/group. (H) Representative images and statistical analysis of colon tumors in the indicated groups (PXR→PXR, n=6; WT→PXR, n=12; PXR→WT, n=6; WT→WT, n=12). (I) Tumor size distribution in the chimera mice treated with L. reu (PXR→PXR, n=6; WT→PXR, n=12; PXR→WT, n=6; WT→WT, n=12). Error bars indicate mean±SD. Statistic test: unpaired Student’s t-test (C, E and H); log-rank (Mantel-Cox) test (B and G); Fisher’s exact test (D and I). Chimera mice: PXR→PXR, PXR KO BMCs were transplanted into irradiated PXR KO mice; WT→PXR, WT BMCs were transplanted into irradiated PXR KO mice; PXR→WT, PXR KO BMCs were transplanted into irradiated WT mice; WT→WT, WT BMCs were transplanted into irradiated WT mice. AOM, azoxymethane; BMC, bone marrow cell; DSS, dextran sulfate; IAA, indole-3-acidic acid; KO, knockout; L. reu, Lactobacillus reuteri; PBS, phosphate-buffered saline; PXR, pregnane X receptor; WT, wild-type; Δiaam L. reu, iaaM deleted Lactobacillus reuteri.
We next investigated the effects of PXR-mediated IL-35+ immune cells on the occurrence and development of colitis cancer. The results revealed that WT BMC-transplanted PXR-KO mice were much more resistant to AOM-DSS-mediated colon carcinoma than PXR-KO BMC-transplanted WT mice were after IAA-producing L. reuteri gavage, whereas there were no differences in PXR-KO BMC-transplanted WT mice and PXR-KO BMC-transplanted PXR-KO mice or WT BMC-transplanted PXR-KO mice and WT BMC-transplanted WT mice (figure 6F–I). Additionally, there were more tumors in PXR-KO BMC-transplanted WT mice and PXR-KO BMC-transplanted PXR-KO mice than in WT BMC-transplanted PXR-KO mice or WT BMC-transplanted WT mice after IAA-producing L. reuteri gavage (figure 6H,I). Taken together, these results suggest that gut microbe-derived IAA inhibits tumorigenesis through IL-35 in immune cells mediated by PXR.
Patients with colorectal carcinoma have decreased levels of IAA
Since gut microbiota-derived IAA can suppress colitis-associated tumorigenesis, we also investigated the potential effects of IAA on human CRC. We collected samples from 43 patients with newly diagnosed CRC, 22 of which were diagnosed with lymph node metastatic CRC (CRC LNM) and 21 of which did not have lymph node metastases (CRC), and 21 healthy controls and then detected the IAA levels in the serum through non-targeted metabolomics LC-MS/MS. The data revealed lower levels of not only Trp but also its metabolites, such as IAA and indole lactic acid, in the peripheral blood of patients with CRC, including both with and without CRC LNM, than in the controls (figure 7A–D; online supplemental figure S4). Notably, there were no differences in the levels of Trp and its metabolites, such as IAA and indole lactic acid, between patients with CRC with and without lymph node metastases (figure 7E,F), suggesting that Trp and its metabolites are not involved in the development of CRC. KEGG enrichment and metabolic pathway analyses revealed that Trp metabolism differed between patients with CRC and healthy individuals, as Trp metabolism was markedly lower in patients with CRC (figure 7G,H). Thus, the serum levels of Trp and its metabolites, such as IAA, are lower in patients with CRC.

Patients with colorectal carcinoma have decreased levels of IAA. (A) Volcano plot illustrating the global metabolic alterations in the sera of patients with CRC (male, n=21) and healthy individuals (male, n=21). (B) Box plot comparing the serum levels of L-tryptophan, IAA and ILA between patients with CRC (male, n=21) and healthy individuals (male, n=21). (C) Volcano plot showing differentially abundant metabolites in the serum of patients with CRC LNM (male, n=22) compared with healthy individuals (male, n=21). (D) Box plot showing the concentrations of L-tryptophan, IAA and ILA in the sera of patients with CRC LNM (male, n=22) and healthy individuals (male, n=21). (E) Comparative analysis of differentially abundant metabolites between metastatic (male, n=22) and non-metastatic CRC (male, n=21). (F) Box plot showing the concentrations of L-tryptophan, IAA and ILA in the sera of patients with CRC LNM (male, n=22) and CRC (male, n=21). (G) KEGG analysis identified top pathways enriched with the differential metabolites in the sera of patients with CRC (male, n=21) and healthy individuals (male, n=21); the abscissa represents the number of annotated differentially abundant metabolites in the signaling pathway, and the ordinate represents the enriched KEGG metabolic pathway. (H) Bubble plot showing the differential metabolic pathways with importance in patients with CRC (male, n=21) and healthy individuals (male, n=21). The color and p value represent the enrichment degree, and the bubble size indicates the impact factor size of the pathway in the topological analysis. Error bars indicate mean±SD (B, D and F). Statistic test: unpaired Student’s t-test (B, D and F). CRC, colorectal carcinoma; CRC LNM, colorectal carcinoma with lymph node metastasis; IAA, indole-3-acidic acid; ILA, indolelactic acid; KEGG, Kyoto Encyclopedia of Genes and Genomes.
Discussion
We found that gut microbiota-derived IAA inhibits the development of colitis-related cancers by reducing the inflammatory response in the colon. IAA can promote IL-35 production through IL-35+ macrophages, B cells and CD4+ T cells, which have strong immunosuppressive effects in vivo and in vitro.12–14 IL-35 acts widely on T cells, B cells, macrophages, dendritic cells and other immune cells,21 promotes the generation of Tregs and anti-inflammatory M2 macrophages, and hinders the differentiation of Th1 cells.15 16 Notably, patients with CRC have lower levels of Trp and its metabolite IAA, which may be one of the reasons why colorectal tumors develop. Indeed, huREG3αIECtg mice with relatively high IAA levels were resistant to AOM-DSS-induced cancer. Therefore, our data suggest that IAA could serve as a potential target for the prevention of colitis-associated cancers.
We demonstrate that combined administration of IAA and LPS can effectively induce IL-35 production in macrophages and IL-35+ B cells.41 However, IAA does not directly promote IL-35 production in CD4+ T cells. The increase in the number of IL-35+ T cells in the colon tissue of IAA-treated mice may be due to the action of IL-35 on T cells, which induces IL-35 expression. Thus, IAA-producing L. reuteri promotes IL-35+ T cells in the colon tissues of mice, suggesting an autocrine cycle in which T cells produce IL-35.19 20 Notably, this cycle is important for maintaining intestinal homeostasis.
IAA-producing L. reuteri can inhibit colorectal tumorigenesis through IL-35-mediated anti-inflammatory effects. Previous studies have suggested that exogenous IL-35 is also a potential therapeutic candidate to prevent the progression of IBD.61 IL-35−/− mice are more sensitive to colitis.25 26 Preventative delivery of IL-35 by Lactococcus lactis can ameliorate DSS-induced colitis in mice.27 28 IL-35-producing B cells could also alleviate IBD in a mouse model via STAT3 phosphorylation and intestinal microbiota modification.62 A recent study in humans noted that serum IL-35 levels were significantly lower in patients with IBD than in healthy individuals.63 64 Multiple studies have also revealed that IL-35 plays an important role in the progression of various cancers, including lung cancer, hepatocellular carcinoma, breast cancer, pancreatic cancer, nasopharyngeal carcinoma, gastric cancer, renal cell carcinoma and CRC.58 65 Our results suggest that IL-35 can inhibit the occurrence and progression of colon cancer induced by AOM-DSS. All of these phenomena are likely derived from the anti-inflammatory effect of IL-35. Indeed, chronic inflammatory disorders of the gastrointestinal tract have been variably associated with increased neoplastic risk,7 and such disorders can accelerate the transformation of IECs into tumor cells.8
Gut microbiota-derived IAA inhibits the development of colitis-associated cancer. Interestingly, the data showed that patients with CRC had lower levels of the Trp metabolite IAA. Thus, IAA-producing Lactobacilli in the gut can potentially act as a preventive factor against CRC. Lactobacillus species, such as L. reuteri, 41 Lactobacillus murinus 55 and Lacticaseibacillus rhamnosus,66 can produce IAA. There is also clinical evidence of using Lactobacillus species as supplements for the prevention and treatment of CRC to reduce its onset or progression.37 Dietary and bacterial indoles (INDs) have also been shown to be promising therapeutic targets for carcinogenesis.67 In addition, Bacteroidetes, such as Bacteroides thetaiotaomicron, Bacteroides ovatus, Bacteroides fragilis, Bacteroides eggerthii, and Parabacteroides distasonis, and Firmicutes, such as Clostridium bartlettii and Eubacterium hallii, also produce IAA.68 These bacterial species could thus potentially be used to prevent colitis. Strategies that target Trp metabolism through specific enzyme inhibitors or customized drugs also hold considerable promise in improving therapeutic efficacy for digestive system tumors.
Many microbial intestinal catabolites of Trp, including IAA, IND, ILA, indole-3-acetamide, indole-3-acrylate, tryptamine, indole-3-pyruvate, indole-3-propionate (IPA), skatole, indole-3-ethanol, indole-3-aldehyde, and indole-3-acetaldehyde, have been identified69 and shown to play crucial roles in shaping innate and adaptive immunity,70 which in turn play important roles in determining the efficacy and prognosis of tumor immunotherapy.71 For example, supplementation with Lactobacillus johnsonii or the Trp metabolite IPA, enhances the efficacy of anti-programmed cell death protein-1 tumor immunotherapy mediated by CD8+ T cells.72 Notably, these Trp metabolites have different influences on the occurrence and development of tumors.39
Data availability statement
Data are available upon reasonable request.
Ethics statements
Patient consent for publication
Ethics approval
This study was conducted with approval from the Institutional Review Board at Nankai University, Tianjin Union Medical Center and Tianjin First Central Hospital (No, No, NKUIRB2024004). Participants gave informed consent to participate in the study before taking part.
References
Footnotes
X @RRCC
JW and YH contributed equally.
Contributors RY designed the research and wrote the paper. JW and YH conducted in vivo and in vitro experiments. YY mainly conducted in vivo experiments. YZ offered assistance for the animal experiments. CX offered assistance for patient materials. All authors read and approved the final manuscript. RY is responsible for the overall content as the guarantor.
Funding This research was supported by NSFC grants 91842302, 82271779, 81901677, ISF-NSFC program 31461143010; CAMS Innovation Fund for Medical Science (CIFMS2017-12M-2-005).
Competing interests None declared.
Provenance and peer review Not commissioned; externally peer reviewed.
Supplemental material This content has been supplied by the author(s). It has not been vetted by BMJ Publishing Group Limited (BMJ) and may not have been peer-reviewed. Any opinions or recommendations discussed are solely those of the author(s) and are not endorsed by BMJ. BMJ disclaims all liability and responsibility arising from any reliance placed on the content. Where the content includes any translated material, BMJ does not warrant the accuracy and reliability of the translations (including but not limited to local regulations, clinical guidelines, terminology, drug names and drug dosages), and is not responsible for any error and/or omissions arising from translation and adaptation or otherwise.