Article Text

Abstract
Background Neural crest-associated genes play pivotal roles in tumor initiation, progression, and the intricate dynamics of the tumor microenvironment (TME). Myeloid-derived suppressor cells (MDSC) within the TME are important in dampening T cell activity and contributing to resistance against immunotherapeutic interventions. The neural crest-associated gene Forkhead Box D1 (FOXD1) has been identified as an oncogenic factor that induces melanoma dedifferentiation and progression. However, the underlying mechanisms and the impact of FOXD1 on the antitumor immune response remain unclear.
Methods To investigate the impacts of FOXD1 on the melanoma microenvironment, we analyzed publicly available datasets from multiple platforms, including TNMplot, TIMER2.0, etc. In addition, FOXD1 was overexpressed (OE) or knocked down in melanoma cells to identify its biological functions in vitro and in vivo. Flow cytometry and arginase activity assay were used to analyze the phenotype and function of MDSC. Western blot, reverse transcription-PCR, or ELISA assays were employed to analyze the expression of FOXD1 and its downstream effectors. In vivo experiments were conducted to investigate the role of FOXD1 in melanoma progression and the influence on MDSC accumulation within the TME.
Results We demonstrate that increased FOXD1 levels inversely correlated with melanoma responsiveness to immunotherapy. Ex-vivo analyses unveiled that monocytes, exposed to conditioned medium from FOXD1-OE melanoma cells, effectively suppressed T cell proliferation and upregulated the expression of programmed death-ligand 1 (PD-L1) and other immunosuppressive factors. FOXD1 was identified as a direct regulator of interleukin 6 (IL6) expression, which is pivotal for MDSC induction. Blocking IL6 reversed MDSC-associated immunosuppression. Additionally, miR-581, a potential negative regulator of FOXD1, attenuated the impact of FOXD1 on IL6 expression and MDSC differentiation. In vivo experiments demonstrated that tumors derived from FOXD1 OE melanoma cells contained a significantly higher frequency of PD-L1+ MDSC compared with controls, while FOXD1 knockdown resulted in reduced tumor growth and diminished MDSC accumulation.
Conclusion Our study elucidated a novel function of FOXD1 in melanoma pathogenesis, highlighting its role in orchestrating the immunosuppressive TME by promoting the generation of MDSC via IL6 upregulation.
- Tumor microenvironment - TME
- Myeloid-derived suppressor cell - MDSC
- Skin Cancer
- Immunosuppression
Data availability statement
Data are available upon reasonable request. All data relevant to the study are included in the article or uploaded as supplementary information. The raw data sets generated, used and analyzed during the current study are available from the corresponding author on reasonable request. The microarray data generated during the study are available from the GEO repository under the number GSE291167.
This is an open access article distributed in accordance with the Creative Commons Attribution Non Commercial (CC BY-NC 4.0) license, which permits others to distribute, remix, adapt, build upon this work non-commercially, and license their derivative works on different terms, provided the original work is properly cited, appropriate credit is given, any changes made indicated, and the use is non-commercial. See http://creativecommons.org/licenses/by-nc/4.0/.
Statistics from Altmetric.com
WHAT IS ALREADY KNOWN ON THIS TOPIC
Neural crest-associated genes are critical for tumor initiation and shaping the tumor microenvironment. Myeloid-derived suppressor cells (MDSCs) suppress antitumor activity of T cells and contribute to immunotherapy resistance in melanoma. Forkhead Box D1 (FOXD1), a neural crest-associated transcription factor, has been described as an oncogenic driver in melanoma but its impact on the antitumor immune response is not fully understood.
WHAT THIS STUDY ADDS
This study demonstrates that FOXD1 upregulates interleukin 6 (IL6) production in melanoma cells, thereby promoting the accumulation of MDSC and Treg within the TME. FOXD1 knockdown reduces IL6 levels and attenuates the accumulation of these immunosuppressive cell populations. Additionally, the study identifies miR-581 as a potential negative regulator of FOXD1, providing insight into the molecular mechanisms controlling the FOXD1/IL6/MDSC axis.
HOW THIS STUDY MIGHT AFFECT RESEARCH, PRACTICE OR POLICY
By delineating the FOXD1/IL6/MDSC axis as a key mechanism of melanoma immunosuppression, our findings suggest that targeting FOXD1 or IL6 could improve the efficacy of immunotherapy. This study also provides a basis for developing predictive biomarkers to guide personalized treatment strategies in melanoma.
Background
Melanoma, an aggressive malignancy originating from melanocytes, continues to present a formidable challenge in the field of oncology due to its intrinsic aggressiveness and resistance to a spectrum of therapeutic interventions.1–3 This malignancy exhibits a pronounced heterogeneity, characterized by the existence of subtypes with diverse biological and morphological attributes, which respond differently to various treatment modalities.4 5 Despite the notable improvements in survival rates of patients with metastatic melanoma owing to the introduction of targeted therapies (eg, BRAF and MEK inhibitors) and immune checkpoint inhibitors (such as anti-programmed cell death protein-1 (PD-1) and anti-CTLA4 antibodies), approximately 50% of patients ultimately succumb to their disease, often due to the development of acquired resistance.5 6 Hence, there is a compelling need to identify novel therapeutic targets to develop effective strategies for the treatment of metastatic melanoma.
Recent progress in cancer research has underlined the central role of the tumor microenvironment (TME) in affecting the progression of melanoma and the efficacy of immunotherapy.7–9 Among the pivotal constituents of the TME implicated in tumor progression, the myeloid-derived suppressor cell (MDSC) population stands out distinctly.7 10 11 MDSCs constitute a diverse array of myeloid cells endowed with potent immunosuppressive capabilities.12–14 Their induction is orchestrated by an array of factors, including well-known actors such as interleukin 6 (IL6).15 16 Through the upregulation of inducible nitric oxide synthase, arginase-1, programmed death-ligand 1 (PD-L1), CD73, etc, MDSC efficiently curtail T cell activity, thereby fostering a milieu conducive to tumor growth.10 15 Moreover, MDSCs have been implicated in conferring resistance to immunotherapeutic approaches, further underscoring their significance with regard to cancer biology.17 18
Neural crest-associated genes and their products have emerged as important factors influencing TME. The neural crest is a transient, multipotent embryonic cell population, which gives rise to an array of cell types throughout the body, including melanocytes. Intriguingly, mounting evidence suggests that neural crest-associated genes extend their influence beyond developmental context, playing substantive roles in tumor initiation, progression, and the complex effects of TME.19–23 This intersection between neural crest development and melanoma pathogenesis underscores the necessity for a comprehensive exploration of the molecular mechanisms underpinning their interaction. Among neural crest-associated genes, the transcription factor Forkhead Box D1 (FOXD1) is of particular interest due to its high expression levels in both neural crest and melanoma cells. Previous studies by our group have demonstrated that FOXD1 plays a pivotal role in melanoma invasion and migration.24 Elevated FOXD1 levels in melanoma correlated with resistance to targeted therapies and the initiation of melanoma lung metastases as substantiated by in vivo experiments.24 25
In this context, we hypothesize that FOXD1 may have a profound regulatory influence on the melanoma TME. This comprehensive study aimed at examining the underlying mechanisms of FOXD1-mediated modulation of the immunosuppressive microenvironment of melanoma and the consequent therapeutic implications.
Methods
Cell culture
Human (A375, HT144) and murine melanoma cell lines (B16F10, 5555) were purchased from the American Type Culture Collection and cultivated in Dulbecco’s Modified Eagle’s Medium (DMEM) (Gibco, Life Technologies) supplemented with 10% heat-inactivated fetal calf serum (FCS, Biochrom), 1% non-essential amino acids (NEAA) (10 mM, Sigma-Aldrich), 0.75% β-mercaptoethanol (0.1 mM, Gibco, Life Technologies) and 1% penicillin/streptomycin (Sigma-Aldrich). The immortalized myeloid suppressor cell line MSC-1 was provided by Dr S Ugel (University of Verona, Italy).26 MSC-1 cells were maintained in Roswell Park Memorial Institute (RPMI)-1640 with Gluta-MAX and supplemented with 1 mM sodium pyruvate (Thermo Fisher), 10% heat-inactivated FCS (Biochrom) and 1% penicillin/streptomycin (Sigma-Aldrich). All cell lines were cultured in a humidified incubator with 5% CO2 at 37°C.
Vector construction and transfection
Human (A375 and HT144) and murine (B16F10 and 5555) melanoma cell lines were transfected with specific lentiviral vectors to knockdown (KD) or to overexpress (OE) FOXD1 as described in our previous study.25 Shortly, HEK293T cells were cultured in DMEM supplemented with 10% FCS, 1% NEAA, 0.75% mercaptoethanol, and 1% penicillin/streptomycin. For lentiviral production, HEK293T cells were transfected with the respective constructs using X-tremeGENE 9 DNA Transfection Reagent (Roche, Basel, Switzerland) following the manufacturer’s protocol. After 12 hours, the transfection medium was replaced, and lentiviral supernatants were harvested 24, 36, and 48 hours post-transfection. The collected supernatants were filtered through sterile syringe filters with a pore size of 0.45 µm. 2×10⁵ melanoma cells were seeded in duplicate wells of a 6-well plate and transduced with 1 mL of the filtered lentiviral supernatant per well. FOXD1 KD/OE in human cell lines was validated by reverse transcription-PCR (RT-PCR) and western blot as described in our previous study.25
RT-PCR and western blot
Total RNA was extracted with the RNeasy Mini Kit (QIAGEN) and transcribed into complementary DNA (cDNA) using the RevertAid First Strand cDNA Synthesis Kit according to the manufacturer’s instructions. Quantitative RT-PCR was performed with the Fast SYBR Green Master Mix System (Invitrogen) using the following thermocycling conditions: 10 min at 95°C, followed by 40 cycles of denaturation (95°C, 15 s), annealing (60°C, 30 s) and extension (72°C, 30 s). The experiment was performed in triplicates and the data are presented as mean±SEM. Used primer sequences can be found in the online supplemental table 1. For protein analysis, cells were lysed in radio-immunoprecipitation assay (RIPA) buffer (Invitrogen) supplemented with a complete protease inhibitor cocktail (Roche). Protein concentrations were determined by the bicinchoninic acid assay (Thermo Scientific). Western blotting was performed according to standard protocols, and protein bands were quantified using ImageJ software (Fiji). The primary antibodies used were: FOXD1 (LS-B9155, LSBio), β-actin (5125S, Cell Signaling), and α-actinin (H-2) (sc-17829, Santa Cruz).
Supplemental material
Microarray
RNA samples at a concentration of 1 µg/µl were submitted to the Genomics and Proteomics Core Facility at DKFZ Heidelberg for microarray analysis. For murine cell lines, gene expression profiling was performed using the Affymetrix GeneChip Mouse Genome 430 2.0 Array (Thermo Fisher Scientific), while for human cell lines the Affymetrix Clariom S Human Assay (Thermo Fisher Scientific) was employed, following the manufacturer’s protocols. The raw cell experiment file (CEL) files were normalized using the Robust Multi-array Average algorithm, and differential gene expression was determined using a Bayesian statistical test, comparing two groups, each with a minimum of two biological replicates. Expression values were then log2-transformed for downstream analyses. Finally, Ingenuity Pathway Analysis (IPA) was used to perform gene set enrichment analyses and identify significantly altered biological pathways. Gene expression datasets were uploaded on the Gene Expression Omnibus (GEO) database (GSE291167).
Chromatin immunoprecipitation assay
Chromatin immunoprecipitation (ChIP) was performed with the EZ ChIP kit (Merck Millipore) according to the manufacturer’s protocol. Briefly, 1–2×10⁶ cells were fixed with 3.6% formaldehyde to crosslink proteins to DNA, followed by lysis on ice. Chromatin was sonicated using the Covaris S220 focused ultrasonicator and the obtained sheared DNA was incubated overnight at 4°C with agarose bead-coupled antibodies. Next, immunoprecipitated chromatin was repeatedly washed and the crosslinks were released. DNA fragments were purified. Quantitative PCR was carried out to amplify the putative FOXD1 binding site using the primers 5'-ACACTGCATCACGTTCCATCT-3' and 5'-CCAGCTGTTTGATCCTGGCT-3'. Results were analyzed using the “% input” method.
Dual-reporter luciferase assay
The dual-reporter luciferase assay was performed using the Dual-Luciferase Reporter Assay System (Promega) according to the manufacturer’s instructions. Briefly, 2×10⁵ HEK293T cells were seeded in 6-well plates and co-transfected with miR-581 or miRNA-NC along with either the control or FOXD1 3'-UTR plasmid, which was cloned into the pmirGLO Dual-Luciferase miRNA Target Expression Vector (Promega). Transfections were performed using Lipofectamine 3000 (Thermo Fisher Scientific) following the standard protocol. After 24 hours, the transfected HEK293T cells were harvested, counted, and reseeded into 96-well black plates with a transparent bottom at a density of 1×10⁴ cells per well. Following an additional 24 hours incubation, firefly and Renilla luciferase activities were measured using a Tecan multimode microplate reader. The relative luciferase activity was determined by normalizing firefly luciferase signals to Renilla luciferase signals. Each experimental condition was performed in triplicate, and data were analyzed using GraphPad Prism software.
Cell viability assay
3×10³ cells were seeded into each well of a 96-well plate in triplicate for each condition. The cells were allowed to adhere and grow for time periods ranging from 24 to 96 hour. At the designated time points, 20 µL of Alamar Blue reagent, diluted to achieve a final concentration of 10%, was added to each well. The plate was then returned to the cell incubator and incubated for an additional 4 hour. After incubation, the fluorescence was measured using a Tecan plate reader, and the data were used to quantify cell viability and proliferation.
ELISA
1×10⁶ cells/mL were cultured in a cell culture flask. After 24 hours, the cell supernatant was collected, filtered, and used to perform the ELISA assay according to the manufacturer’s instructions (R&D Systems) to detect the expression of IL6.
Incubation of monocytes with conditioned medium
Melanoma cells were cultured at a density of 1×10⁶ cells/mL, and the cell supernatant was collected and filtered through a 0.45 µM filter to obtain the conditioned medium (cond. med.). Human CD14+ monocytes were isolated from buffy coats of healthy donors using MACS (Miltenyi Biotec) according to the manufacturer’s protocol. The isolated CD14+ monocytes were then cultured in cond. med. at 1×10⁶ cells/mL for 24–48 hour, after which they were subjected to various assays, including arginase activity and T cell suppression assays, to evaluate their functional properties.
Arginase activity assay
Arginase activity of 1×10⁶ cells was determined using the Arginase Activity Assay Kit (Sigma-Aldrich) according to the manufacturer’s instructions.
Inhibition of T cell proliferation assay
CD3+ T cells were isolated from healthy donor PBMCs using magnetic-activated cell sorting (Miltenyi Biotec) and labeled with 10 µM cell proliferation dye eFluor 450 (eBioscience) at room temperature for 20 min. The labeled T cells were then co-cultured with CD14+ monocytes that had been preincubated in cond. med. for 24 hours. Co-cultures were established in stable isotope labeling with amino acids in cell culture (SILAC) medium RPMI 1640 (Thermo Fisher Scientific) supplemented with 40 ng/mL L-lysine hydrochloride (Sigma), 10% fetal bovine serum (Gibco), 1% penicillin/streptomycin (Gibco), and 150 nM freshly prepared L-arginine (Sigma). Cells were seeded in 96-well round-bottom plates (Sarstedt) that were precoated for 2 hours with anti-CD3 (1 µg/mL, clone OKT-3, eBioscience) and anti-CD28 (2 µg/mL, clone CD28.2, Beckman Coulter) antibodies. After a 3 day co-culture period, T-cell proliferation was assessed by measuring the dilution of the eFluor 450 dye using a BD LSRFortessa flow cytometer.
Flow cytometry
Cells were first incubated with an Fc receptor Blocking Reagent (BD Biosciences) and then stained with Fixable Viability Stain 700 (BD Biosciences) along with the specific antibodies listed in online supplemental table 2. For intracellular staining, the cells were fixed and permeabilized following the manufacturer’s instructions using the eBioscience Foxp3/Transcription Factor Staining Buffer Set (Thermo Fisher). Data acquisition was carried out using a BD LSRFortessa flow cytometer. The data were analyzed with FlowJo V.10 software (BD Biosciences).
Supplemental material
Mouse in vivo studies
NOG mice and wild-type C57BL/6 mice were used to assess the effects of FOXD1 manipulation on tumor growth. For the tumor growth experiments, both NOG and C57BL/6 mice were subcutaneously injected with 1×10⁶ B16F10 cells and 1×10⁶ 5555 cells in either the control or FOXD1 KD groups. Tumor length (L) and width (W) were measured using a vernier caliper at indicated times, and tumor volumes were calculated using the formula L×W2/2. Mice meeting the termination criteria were sacrificed and recorded as deceased.
To compare survival rates between FOXD1 OE and control groups, 8–10 weeks old wild-type C57BL/6 mice were subcutaneously injected with 1×10⁵ FOXD1 OE and control B16F10 cells per mouse. Tumor growth was monitored daily from day 8 postinjection (n=6 per group, in total 12 mice were included). In a separate experiment, wild-type C57BL/6 mice were injected with 1×10⁵ FOXD1 OE, FOXD1 KD and their respective control B16F10 cells. Tumors, spleens, and lymph nodes were collected between days 18 and 20 postinjection for flow cytometric analysis.
All in vivo studies were performed in accordance with the Regulations for the Care and Use of Laboratory Animals. The NOG mouse tumor model (figure 1B, online supplemental figure 1C) and the FOXD1 KD experiments in the C57BL/6 mouse model (online supplemental figure 1B,4A-D) were approved by the Institutional Animal Care and Use Committee (IACUC) of Beijing Langke Biotech (IACUC Number: IACUC-20241217–01). In addition, the experiments shown in figure 1A and figure 6A–H received ethical approval from the Regierungspräsidium Karlsruhe (G-159/19) and were conducted in compliance with all applicable ethical and legal standards. All mice used in these studies were 8–10 weeks old and housed either in the Central Animal Laboratory of the German Cancer Research Center or at Beijing Langke Biotech under the care of licensed veterinarians. Mice were maintained in groups of 3–6 per cage in environmentally controlled facilities with regulated temperature, humidity, and a 12-hour light/dark cycle. Animals were monitored daily for health and well-being, and any animal exhibiting adverse symptoms was promptly humanely euthanized in accordance with institutional guidelines.
Supplemental material
Data retrieval and processing
Public patient datasets were obtained from several online databases, including TNMplot (https://tnmplot.com/analysis/), ROC Plotter (https://www.rocplot.org/), Kaplan-Meier Plotter, the R2 Genomics analysis and visualization platform (http://hgserver1.amc.nl), and the GEO. Kaplan-Meier survival curves were generated using either available survival data from these databases or through reanalysis with Chipster. The TIMER2.0 database (http://timer.cistrome.org/) was used to further verify the correlation between FOXD1 and the infiltration of immune cells. Specifically, in TIMER2.0, MDSC are defined by a gene expression signature that reflects the expression of immunosuppressive markers, distinguishing these cells from monocytes isolated from peripheral blood mononuclear cells.27 28 These data were obtained in strict accordance with the publication guidelines approved by the above database. Therefore, there was no requirement for ethics committee approval.
Statistical analysis
Data were displayed as mean±SEM of at least three independent experiments and student’s two-sided t-test was used to compare data between two groups. One-way analysis of variance (ANOVA) test was used to compare data between three groups. Correlation analysis was done by Pearson correlation with two-tailed p value. Survival curves were generated using the Kaplan-Meier approach and statistical comparison was done by the Logrank (Mantel-Cox) test. The effect of FOXD1 on tumor growth was evaluated by two-way ANOVA, and comparisons were done by Bonferroni’s multiple comparisons test. All calculations were performed with GraphPad Prism V.9.0.0 for Windows statistical software package. A value of p<0.05 was considered statistically significant.
Results
High FOXD1 expression in melanoma is associated with an immunosuppressive phenotype
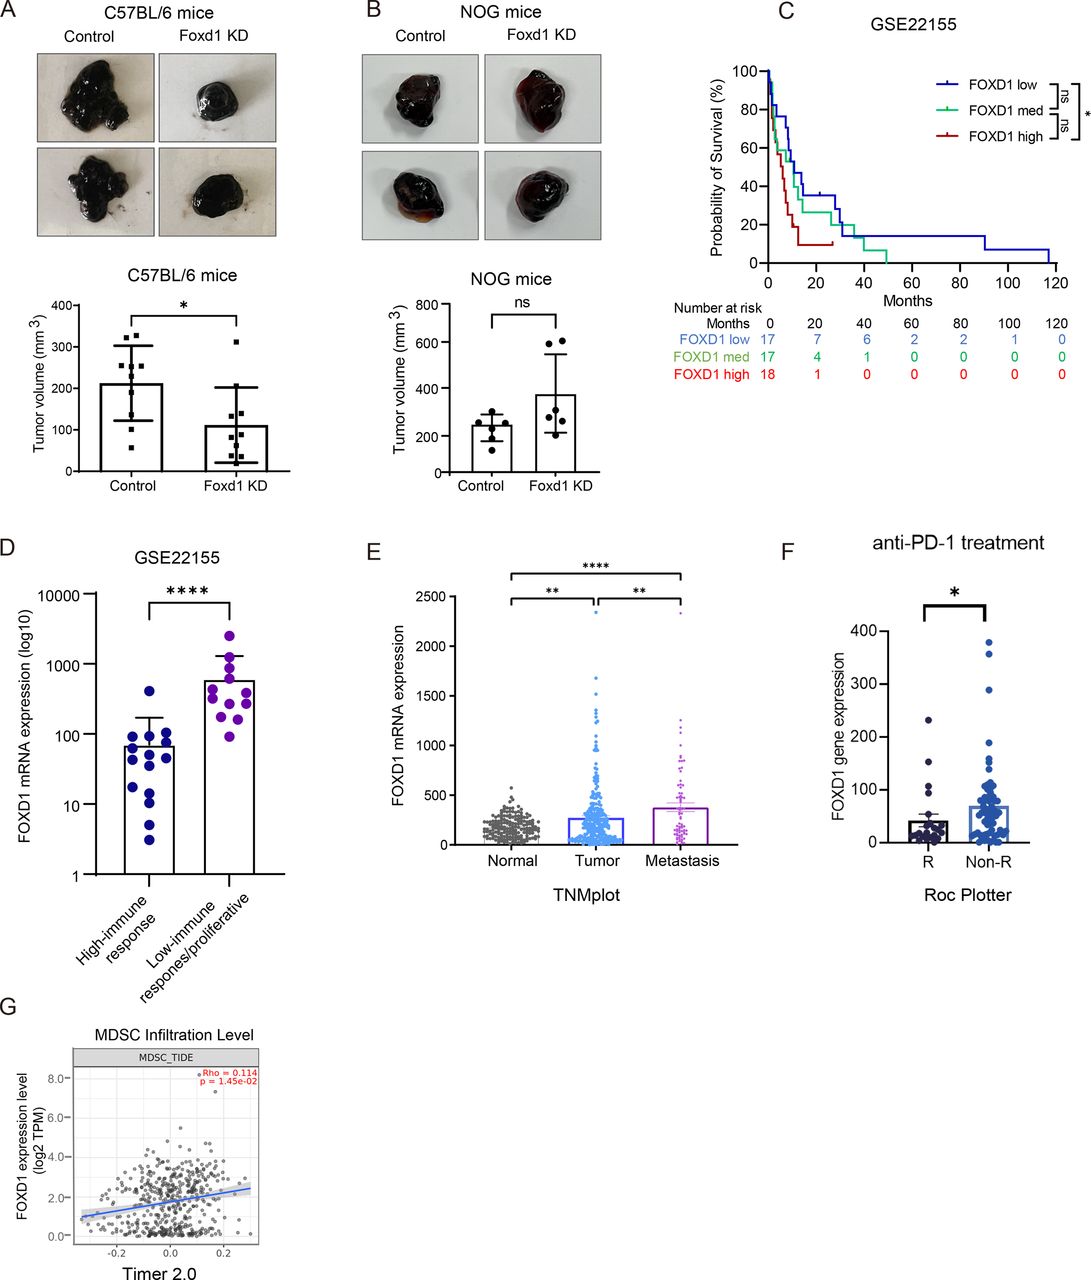
Previous studies have highlighted the significant role of FOXD1 in regulating melanoma metastasis and resistance to targeted therapy. However, its specific role within the melanoma microenvironment remains incompletely understood. In this study, we first investigated the impact of FOXD1 KD on melanoma growth using both immunocompetent (C57BL/6) and immunodeficient (NOG) mice. Our findings revealed that FOXD1 KD in B16F10 and 5555 melanoma cells significantly reduced tumor growth in immunocompetent mice (figure 1A, online supplemental figure 1A,B) whereas no significant difference in tumor size was observed in immunodeficient mice (figure 1B, online supplemental figure 1C). To determine whether FOXD1 KD affects the intrinsic replication potential of melanoma cells, we assessed cell viability using the Alamar Blue assay. Consistent with our previous study FOXD1 KD did not result in significant differences in cell proliferation in vitro for both B16F10 and 5555 cell lines (online supplemental figure 1D).24 25 These findings suggest that the TME is likely a predominant factor mediating the observed effects of FOXD1 on melanoma growth. Next, we conducted a microarray analysis to compare gene expressions between FOXD1 KD and control B16F10 cells, followed by IPA. We found that FOXD1 KD in melanoma cells showed an activation of pathways related to melanoma differentiation, for example, melanocyte development and pigmentation signaling, which is consistent with our previous study (online supplemental figure 1E).25 Furthermore, several signaling pathways involved in MDSC stimulation, such as IL6, IL8 and granulocyte-macrophage colony-stimulating factor signaling, were deactivated after silencing FOXD1 (online supplemental figure 1E).29–32 Reanalysis of the publicly available data GSE22155 revealed that patients with melanoma with high FOXD1 expression (FOXD1high) showed significantly lower survival compared with those with low FOXD1 expression (FOXD1low) (figure 1C). In addition, in this dataset, tumor samples from 27 patients with melanoma were classified into low and high-immune response groups according to Jönsson G et al.33 We found that the level of FOXD1 was significantly higher in the low-immune response group compared with the high-immune response group (figure 1D). Further examination using the TNMplot online web tool demonstrated significantly higher FOXD1 expression in metastatic melanoma samples (Metastasis) compared with both normal skin and non-metastatic melanoma samples (Primary) (figure 1E).34 Using the Kaplan-Meier Plotter online tool, 67 patients with melanoma were categorized based on FOXD1 expression levels into high expression (top 33%) and low expression (bottom 33%) groups, a trend of decreased survival was found among patients with melanoma with high FOXD1 expression under PD-1 treatment (online supplemental figure 1F).35 In line with this, using the Roc Plotter online tool, patients with melanoma who displayed no responsiveness to anti-PD-1 treatment exhibited higher expression levels of FOXD1 (figure 1F).35 Interestingly, by checking the data from the TIMER2.0 database, analyzing the infiltration of MDSC using multiple datasets from online published data, we found a positive correlation between FOXD1 expression and the infiltration of cells defined by this database as MDSC (figure 1G).

High FOXD1 expression in melanoma cells is associated with tumor progression. (A) Representative images of excised tumors at day 14 (top) on subcutaneous injection of 1×10⁶ Foxd1 KD or control B16F10 cells into C57BL/6 mice. The volume of tumors was measured at day 14 and compared between the control (n=9) and Foxd1 KD group (n=10) (bottom). One mouse from the control group was excluded from analysis due to death/sacrifice for reasons unrelated to tumor burden or its complications. (B) Representative images of excised tumors at day 14 (top) on subcutaneous injection of 1×10⁶ FOXD1 KD or control B16F10 cells into NOG mice. The volume of the tumors was measured at day 14 and compared between the control (n=6) and FOXD1 KD group (n=6). (C) Survival analysis of patients with melanoma was performed using the GSE22155 dataset. Patients were equally categorized into three groups: FOXD1 high expression group (FOXD1 high), FOXD1 intermediate expression group (FOXD1 med) and FOXD1 low expression group (FOXD1 low). (D) GSE22155 dataset was used to assess the expression of FOXD1 in relative read counts. The low-immune response group was identified by an absence of expression of immune response–related genes (n=12); High-immune response group, or proliferative group was characterized by heightened expression of genes associated with diverse immunologic processes (n=15). (E) The expression level of FOXD1 in normal skin, primary melanoma and metastatic melanoma. Plots were created using TNMplot analysis based on gene chip data which were generated from GEO datasets. (F) Intratumoral expression levels of FOXD1 in samples from patients with melanoma treated with immunotherapy (R: responder, Non-R: non-responder). Analysis conducted using the ROC plotter online tool. (G) The correlation between expression level of FOXD1 and the MDSC infiltration level from the TCGA_SKCM dataset was shown using the TIMER2.0 online tool. Data were displayed as mean±SEM. Student’s two-sided t-test was used to compare data between two groups, *p<0.05, **p<0.01, ***p<0.001, ****p<0.0001. FOXD1 KD, Forkhead Box D1 knockdown; GEO, Gene Expression Omnibus; MDSC, myeloid-derived suppressor cell; mRNA, messenger RNA; PD-1, programmed cell death protein-1; TPM, transcripts per million.
Effect of FOXD1 KD on MDSC-mediated T cell suppression in vitro
To investigate whether intratumoral FOXD1 exerts an effect on MDSC, we incubated CD14+ monocytes for 24 hours in the cond. med. collected from either FOXD1 KD or its negative control (NC) human melanoma cells (figure 2A). We found that the FOXD1 KD group exhibited significantly lower amounts of PD-L1+ CD14+ monocytes compared with the NC group (figure 2B,C). Of note, human monocytic MDSC are distinguished from human monocytes by low expression or absence of HLA-DR molecules.14 On exposure to cond. med., both the NC and FOXD1 KD groups demonstrated a significantly decreased expression of HLA-DR among CD14+ monocytes compared with the medium control (figure 2D,E). Moreover, CD14+ monocytes from the FOXD1 KD group exhibited higher expression levels of HLA-DR than those from the NC group (figure 2D,E). Additionally, the treated CD14+ monocytes from the FOXD1 KD group displayed markedly lower arginase activity than those from the NC group (figure 2F). These results indicate that knocking down FOXD1 in melanoma cells can reduce the conversion of monocytes into immunosuppressive cells (MDSC-like cells). To verify the immunosuppressive function of treated CD14+ monocytes, they were co-cultured with stimulated CD3+ T cells for 72 hours. Figure 2G,H shows that the proliferative capacity of activated T cells was significantly higher in the FOXD1 KD group than in the NC group after co-culture with CD14+ monocytes.

FOXD1 knockdown attenuates the acquisition of immunosuppressive properties by human monocytes in vitro. (A) Schematic diagram of monocyte induction with conditioned medium (cond. med.) derived from melanoma cells. (KD: knockdown, NC: negative control). (B) Representative gating strategy for PD-L1+ CD14+ monocytes on treatment with cond. med. from NC and FOXD1 KD melanoma cells for 24 hours. Isotype for the PD-L1 antibody was used as gating control. (C) Quantification of the percentage of PD-L1-expressing CD14+ monocytes on the treatment with cond. med. from NC or FOXD1 KD melanoma cells (n=6–8). (D) Representative dot plot showing HLA-DR expression on CD14+ monocytes treated with normal cell medium (MEF) and cond. med. from NC and FOXD1 KD melanoma cells for 24 hours. (E) MFI (median fluorescence intensity) of HLA-DR among total CD14+ monocytes on the incubation with MEF medium control and cond. med. from control and FOXD1 KD melanoma cells for 24 hours (n=6–8). (F) Arginase activity in CD14+ monocytes on the treatment with cond. med. from NC or FOXD1 KD melanoma cells. Results are shown as unit/L (n=6). (G) Representative histogram for CD3+T cell proliferation assessed by eFluor 450 dilution after 3 days of co-culture with treated CD14+ monocytes. (H) Quantification of T cell proliferation on co-culture with monocytes treated with cond. med. from control or FOXD1 KD melanoma cells. Cumulative data for T cell proliferation are presented as the percentage of divided T cells normalized to the respective control of stimulated T cells alone (n=4–5). Statistical analysis was performed with student’s two-sided t-test. *p<0.05; **p<0.01; ***p<0.001. Data were displayed as mean±SEM. PD-L1, programmed death-ligand 1.
Impact of FOXD1 OE on MDSC-mediated T cell suppression in vitro
Next, we OE FOXD1 in melanoma cells to assess whether this can induce T cell suppression via MDSC. Consistent with previous findings, we observed a significant increase of the PD-L1+ cells among CD14+ monocytes on treatment with cond. med. derived from FOXD1 OE melanoma cells compared with the control group (figure 3A). These results were corroborated by quantitative RT-PCR (qRT-PCR) analysis, demonstrating a significantly elevated expression of PD-L1 in monocytes from the FOXD OE group compared with the control group (figure 3B). Additionally, culturing CD14+ monocytes with cond. med. from FOXD1 OE melanoma cells resulted in a lower expression of HLA-DR compared with the negative control (figure 3C). Furthermore, CD14+ monocytes from the FOXD1 OE group exhibited higher arginase activity than those from the control group (figure 3D). Moreover, when we cultured immortalized myeloid suppressor cells MSC-1 with the cond. med. from FOXD1 OE melanoma cells and parental melanoma cells, we observed an upregulation of the expression of factors related to MDSC such as IL6, IL10, PD-L1, COX-2, PTGES, and TGF-β (figure 3E). Additionally, figure 3F shows a significant reduction of T cell proliferation following co-culturing with CD14+ monocytes treated with the cond. med. from FOXD1 OE melanoma cells as compared with the control.

Impact of FOXD1 overexpression on immunosuppressive functions of monocytes in vitro. (A) Quantification of the percentage of PD-L1+ cells among total CD14+ monocytes treated with cond. med. from control and FOXD1 OE melanoma cells for 24 hours. (OE: overexpression; n=9–12). (B) Quantification of the PD-L1 expression by RT-qPCR in induced CD14+ monocytes treated with cond. med. from control and FOXD1 OE melanoma cells for 24 hours (n=4–7). (C) MFI of HLA-DR among total treated CD14+ monocytes after culturing with MEF medium control and cond. med. from control and FOXD1 OE melanoma cells for 24 hours (n=9–12). (D) Arginase activity in induced CD14+ monocytes expressed in units/mL after incubation with cond. med. from control or FOXD1 OE melanoma cells for 24 hours (n=6). (E) MSC-1 cells were treated for 24 hours with cond. med. from control or FOXD1 OE melanoma cells. The mRNA expression of the indicated genes was measured by RT-PCR. Values were normalized to the housekeeping gene GAPDH (n=3). (F) Quantification of T cell proliferation on co-culture with monocytes stimulated with cond. med. from control or FOXD1 OE melanoma cells. Cumulative data for T cell proliferation are presented as the percentage of divided T cells normalized to the respective control of stimulated T cells alone (n=4). Statistical analysis was performed with student’s two-sided t-test. *p<0.05; **p<0.01; ***p<0.001. Data were displayed as mean±SEM. cond. med., conditioned medium; FOXD1, Forkhead Box D1; IL, interleukin; MEF, mouse embryonic fibroblast; MFI, median fluorescence intensity; mRNA, messenger RNA; PD-L1, programmed death-ligand 1; RT-qPCR, reverse transcription quantitative PCR.
Regulation of IL6 expression by FOXD1
Our previous study highlighted the role of IL6 in generating immunosuppressive MDSC in melanoma.16 To investigate the relationship between FOXD1 and IL6, we analyzed its levels in melanoma cells on ectopic OE of FOXD1 using qRT-PCR. The results revealed a significantly higher IL6 expression in FOXD1 OE cells than in parental control cells (figure 4A). Using ELISA, we detected notably more IL6 in the supernatant from FOXD1 OE cells than in that from the control group (figure 4B). On the other side, FOXD1 KD in both human and mouse melanoma cell lines resulted in a significant reduction in IL6 levels in the cond. med. (online supplemental figure 2A,B). Furthermore, comparative analysis of expression data in patients with melanoma from GSE130244 revealed a positive correlation between FOXD1 and IL6 expression (figure 4C). In order to clarify if FOXD1 directly controls the transcription of IL6, we performed a ChIP-qPCR analysis that identified a FOXD1-binding site in the IL6 promoter, suggesting that FOXD1 directly regulates IL6 expression (figure 4D). To investigate the role of IL6 in the FOXD1-MDSC-T cell axis in the melanoma microenvironment, we added a neutralizing IL6 antibody (ab) to the cond. med. from FOXD1 OE melanoma cells, which was then added to CD14+ monocytes, followed by T cell proliferation analysis. An isotype ab was used as a negative control. The results indicated that the monocyte population treated with cond. med. from FOXD1 OE melanoma cells supplemented with IL6 ab exhibited significantly lower amounts of PD-L1+ subpopulation of CD14+ monocytes compared with the isotype group (figure 4E). Moreover, IL6 ab supplementation increased the expression level of the HLA-DR of CD14+ monocytes and resulted in a notably lower arginase activity of treated CD14+ monocytes compared with the isotype control (figure 4F,G). Moreover, decreased T cell proliferation was partially restored on co-culturing T cells with monocytes treated with cond. med. from FOXD1 OE melanoma cells supplemented with IL6 ab as compared with the isotype control-treated group (figure 4H).

Regulation of IL6 expression by FOXD1. (A) The expression level of IL6 measured by RT-PCR in FOXD1 OE and control melanoma cells (n=3–4). (B) The protein level of IL6 in cond. med. from FOXD1 OE and control melanoma cells. The expression of IL6 was investigated by ELISA (n=5). (C) Correlation of the expression of IL6 and FOXD1 using the GSE130244 dataset. (D) ChIP-qPCR analysis to investigate the recruitment of FOXD1 onto the IL6 promoter region (n=3). (E) Percentage of PD-L1+ cells on stimulation of CD14+ monocytes with cond. med. from control or FOXD1 OE melanoma cells supplemented with an anti-IL6 antibody (n=4–5). (F) MFI of HLA-DR among total CD14+ monocytes incubated with cond. med. from control and FOXD1 OE melanoma cells supplemented with an anti-IL6 antibody (n=4–5). (G) Arginase activity of CD14+ monocytes expressed in units/L on the treatment with cond. med. from control or FOXD1 OE melanoma cells supplemented with an anti-IL6 antibody (n=4–5). (H) T cell proliferation assay. CD3+ T cells were co-cultured with monocytes that were stimulated with cond. med. from control or FOXD1 OE melanoma cells with or without supplementation with a blocking anti-IL6 ab (n=4–5). Cumulative data for T cell proliferation are presented as the percentage of divided T cells normalized to the respective control of stimulated T cells alone (n=4). Statistical analysis was performed with the student’s two-sided t-test. *p<0.05; **p<0.01; ***p<0.001. Data were displayed as mean±SEM. ChIP-qPCR, chromatin immunoprecipitation quantitative PCR; cond. med., conditioned medium; FOXD1 OE, Forkhead Box D1 overexpression; IL6, interleukin 6; MFI, median fluorescence intensity; PD-L1, programmed death-ligand 1; RT-PCR, reverse transcription PCR.
miR-581 downregulates FOXD1 expression, leading to reduced capacity to induce immunosuppressive activity of monocytes
Given the potential of elevated FOXD1 expression to induce an immunosuppressive microenvironment in melanoma, we focused on identifying strategies to block FOXD1. By using two databases “miRDB” and “TargetScanHuman”, we identified miR-581 as a potential regulator of FOXD1 expression (online supplemental figure 3A,B). To investigate if miR-581 has the capacity to block FOXD1 expression in melanoma cells, we transfected two different melanoma cell lines (A375, HT144) with either miR-581 mimics or a miR mimic control (miR-NC) (figure 5A). Transfection with miR-581 mimics resulted in a significant decrease in FOXD1 expression as compared with the control (figure 5B). Next, we performed a microarray analysis to investigate expression changes on miR-581 transfection in more depth. In FOXD1 OE melanoma cells, we observed inhibition of MITF activity, a crucial transcription factor involved in melanocyte differentiation. Conversely, in cells transfected with miR-581 mimics, MITF activity was activated. These findings further substantiate the notion that miR-581 blocks FOXD1, at least partially (online supplemental figure 3C). To determine whether FOXD1 is a direct target of miR-581, we constructed dual-luciferase reporter vectors containing the predicted miR-581 seed sequence within the 3ʹUTR of FOXD1 as well as corresponding mutant vectors in which random nucleotide substitutions were introduced into the seed region. On transfection with miR-581 mimics, cells expressing the wild-type FOXD1 3ʹUTR construct exhibited a significant reduction in firefly luciferase activity compared with controls, whereas the mutant construct showed no significant change. These results confirm that miR-581 directly targets the FOXD1 3ʹUTR, thereby regulating its expression (figure 5C). Subsequently, miR-581 mimics also significantly suppressed IL6 expression in melanoma cells (figure 5D). Moreover, the treatment of CD14+ monocytes with cond. med. from melanoma cells transfected with miR-581 mimic yielded a lower frequency of PD-L1+ CD14+ subpopulation and higher expression of HLA-DR among CD14+ monocytes (figure 5E F). Moreover, the arginase activity of CD14+ monocytes treated with miR-581 mimics was also reduced as compared with the mimic control (figure 5G). Finally, the T cell proliferation assay indicated a significantly increased T cell proliferation on co-culture with monocytes treated with cond. med. from melanoma cells transfected with miR-581 mimics as compared with the mimic control (figure 5H).

miR-581 downregulates FOXD1 expression and thereby reduces the immunosuppressive capacity of MDSC. (A) Representative images confirming the successful transfection of melanoma cells with miR-581 mimics using 40 pmol FAM-labeled miRNA-581 mimics and 40 pmol of mimics control (miR-NC) for 48 hours. (B) Quantification of the FOXD1 expression in HT144 cells treated with mimics control or miR-581-mimics by RT-qPCR and western blot (n=3). (C) A dual-reporter luciferase assay was performed in HEK293T cells to evaluate the direct targeting of the FOXD1 3′-UTR by miR-581. The upper panel shows the predicted binding sites, and luciferase activities were measured in cells co-transfected with reporter constructs containing either the wild-type FOXD1 3′-UTR or mutant sequences along with miR-581 mimics or miR-NC (n=5). (D) ELISA was used to investigate the protein level of IL6 in cond. med. from A375 and HT144 melanoma cells treated with miR-581-mimics or mimic control (n=3). (E) Percentage of PD-L1+ cells on stimulation of CD14+ monocytes with cond. med. from melanoma cells treated with miR-581-mimics or miR-NC (n=4–5). (F) MFI of HLA-DR among total CD14+ monocytes incubated with cond. med. from melanoma cells treated with miR-581-mimics or mimic control (n=4–5). (G) Arginase activity of CD14+ monocytes expressed in units/L on the treatment with cond. med. from melanoma cells treated with miR-581-mimics or miR-NC (n=4–5). (H) T cell proliferation assay. CD3+ T cells were co-cultured with monocytes that were stimulated with cond. med. from melanoma cells treated with miR-581-mimics or miR-NC (n=4–5). Statistical analysis was performed with student’s two-sided t-test. *p<0.05; **p<0.01; ***p<0.001. Data were displayed as mean±SEM. cond. med., conditioned medium; FAM, carboxyfluorescein; FOXD1, Forkhead Box D1; IL6, interleukin 6; MDSC, myeloid-derived suppressor cell; MFI, median fluorescence intensity; NC, negative control; PD-L1, programmed death-ligand 1; RT-qPCR, reverse transcription quantitative PCR.
FOXD1 expression modulates MDSC accumulation in melanoma microenvironment
In order to confirm our in vitro experiments in an in vivo setting, we investigated the impact of FOXD1 OE on melanoma progression using an immunocompetent C57BL/6 mouse model. Mice received subcutaneous injections of 1×10⁵ B16F10 cells that were either transfected with a FOXD1 OE construct or an empty control vector. Kaplan-Meier survival analysis revealed that mice bearing FOXD1 OE tumors exhibited significantly reduced overall survival compared with the control group (figure 6A). The measurement of tumor volume up to day 18 showed a significant increase in the tumor size in the FOXD1 OE group (figure 6B). Flow cytometric analysis of tumors and immune organs showed a markedly higher frequency of CD11b+ Gr1+ cells in both tumors and spleens, with a similar trend observed in the lymph nodes, in mice with FOXD1 OE tumors relative to controls (figure 6C,D). An elevated frequency of PD-L1+ CD11b+ Gr1+ cells was also detected across all examined organs in the FOXD1 OE group (figure 6E,F). Additionally, FOXD1 OE tumors displayed an increased proportion of CD4+ CD25+ FOXP3+ regulatory T cells (Treg) (figure 6G, online supplemental figure 4A,B). Moreover, the accumulation of intratumoral MDSC was correlated with an increase in the frequency of tumor-infiltrating Treg (R=0.589, p=0.006) (figure 6H).

FOXD1 expression modulates MDSC accumulation in melanoma microenvironment. (A) Wild-type C57BL/6 mice were injected subcutaneously with FOXD1 OE and control B16F10 cells (1×10⁵ cells). Mice meeting termination criteria were euthanized and noted as deceased. Survival of mice is shown as a Kaplan-Meier curve (n=6). (B) Quantification of the tumor volume on subcutaneous injection of control or FOXD1 OE melanoma cells (1×10⁵ cells) into mice. Results are presented as the size of tumors in cm3 (n=4–6, two mice were excluded from the control group as the tumor size was undetectable by day 18). (C) Gating strategy for MDSC (CD11b+Gr1+) in tumor. Tumors and immune system organs were harvested for flow cytometric analysis from day 18 to day 20 after tumor cell inoculation. (D) MDSC in spleen, lymph nodes and tumor. Results are shown as the frequency of CD11b+Gr1+ cells among CD45+ leukocytes. (E) Gating strategy for the flow cytometry-based quantification of PD-L1+ cells among total MDSC isolated from tumors, lymph nodes and spleens. PD-L1 FMO was used as gating control. (F) Quantification of PD-L1+ MDSC in spleen, lymph node and tumor. Data are presented as the frequency of PD-L1+ cells among total MDSC (n=8). (G) Quantification of Treg isolated from spleen, lymph node and tumor. Results are shown as the frequency of CD4+CD25+Foxp3+ cells among total CD4+ T cells (n=8). (H) The frequency of Treg among total CD4+ cells was plotted against the percentage of MDSC within CD45+ leukocytes in tumors and spleens from respective mice (n=11). The correlation was evaluated by a linear regression analysis. Statistical analysis was performed with the student’s two-sided t-test and two-way ANOVA. *p<0.05; **p<0.01; ***p<0.001. Data were displayed as mean±SEM. ANOVA, analysis of variance; FOXD1 OE, Forkhead Box D1 overexpression; FMO, fluorescence minus one; FSC, forward scatter; MDSC, myeloid-derived suppressor cell; PD-L1, programmed death-ligand 1; SSC, side scatter; Treg, regulatory T cell.
To further elucidate the immune-dependent effects of FOXD1, we conducted additional in vivo experiments using FOXD1 KD B16F10 cells. C57BL/6 mice injected with FOXD1 KD cells displayed a significantly lower frequency of CD11b+ Gr1+ and reduced PD-L1 CD11b+ Gr1+ cells in both tumors and spleens compared with controls (online supplemental figure 5A,B). Furthermore, Treg infiltration was significantly diminished in tumors, spleens, and lymph nodes of the FOXD1 KD group (online supplemental figure 5C), and a significant positive correlation between Treg and MDSC frequencies was also observed in tumor tissues (online supplemental figure 5D).
Discussion
Malignant melanoma is often associated with poorer survival rates and resistance to therapy. The underlying mechanism involves the enhancement of melanoma stemness and plasticity, the upregulation of migration and invasion abilities, and the development of a pro-TME.19–22 Heppt et al reported that a neural crest-associated gene MSX1 could induce the phenotype switching and migration of melanoma.36 Boshuizen et al showed that the expression of NGFR, identified as a putative melanoma stem cell marker, was a predictor of non-response to BRAF + MEK inhibition.37 Moreover, they found that high expression of NGFR correlated with immune exclusion in patients with melanoma.37 Melanoma cell states were described as undifferentiated, neural crest–like, transitory, and melanocytic subtypes, each of which appears to modulate immune cells in the TME.38 In particular, the undifferentiated subtype enriched for invasive and inflammatory gene sets may promote angiogenesis (eg, via VEGF secretion) and recruit immunosuppressive cells such as MDSC.38–40 The neural crest–like subtype may affect the interaction with extracellular matrix components and modulate immune cell recruitment, whereas the transitory subtype represents an intermediate state that could influence tumor metabolism and redox balance.38 The melanocytic subtype, being the most differentiated, tends to establish a TME with a distinct mode of immune interaction, such as antigen presentation.38 41 A previous study by our group suggested that the neural crest marker FOXD1 serves as a key factor in regulating melanoma phenotype switching and resistance to treatment.25 In line with our previous research, numerous studies have highlighted the significant role of the transcription factor FOXD1 in tumorigenesis, which often functions as an oncogene.24 25 42–47 For instance, Li et al observed in oral squamous cell carcinoma that increased FOXD1 levels were linked to cervical node metastasis and poor prognosis.42 Similarly, Pan et al demonstrated that heightened FOXD1 expression prompted the activation of the ERK1/2 pathway, contributing to tumor progression in colorectal cancer.48 Moreover, FOXD1 expression has been positively correlated with macrophage infiltration and the expression of immunosuppressive genes in head and neck squamous cell carcinoma.23 However, the specific impact of FOXD1 in the melanoma microenvironment remains under-explored and warrants further investigation. As an important component of the immune cell population in the TME, MDSCs have potent capacity to impede T cell proliferation and activation, which highlights their critical role in driving tumor progression.10 17 49–51 In our in vivo experiments, we observed that knocking down FOXD1 expression in melanoma cells resulted in significantly smaller tumors compared with the control group. Interestingly, this effect was only observed in immunocompetent mice, but not in immunodeficient mice, suggesting a critical role of the immune system in the effect of FOXD1 on tumor growth. To evaluate the direct influence of FOXD1 on the melanoma microenvironment, we injected FOXD1 OE and control melanoma cells into immunocompetent C57BL/6 mice. As anticipated, the FOXD1 OE group exhibited a notable increase in tumor volume, distinctly surpassing the tumor volume of the control group by day 18 (figure 6B). Our flow cytometry analysis revealed an increased frequency of CD11b+Gr1+ MDSC-like cells, expressing immunosuppressive marker PD-L1 within FOXD1 OE tumors as compared with the control group, suggesting that FOXD1 exerts an immunosuppressive effect in vivo by modulating MDSC. Intriguingly, we also observed a significant elevation of the Treg frequency within the FOXD1 OE group, positively correlating with concomitant accumulation of MDSC-like cells (figure 6G,H). This data is in agreement with multiple studies indicating a bidirectional interaction between MDSC and Treg in cancer.52–54 Conversely, KD of FOXD1 exhibited a lower amount of MDSC-like cells as well as PD-L1 expression on these cell populations, and also lower amounts of Treg in comparison with control in vivo. Taken together, these results provide evidence for the involvement of FOXD1 in facilitating MDSC-mediated immunosuppression.
Numerous publications described the association of elevated IL6 expression with tumor progression and treatment resistance in various cancers, including melanoma. Our previous investigations showed that increased IL6 expression in melanoma was associated with worse treatment outcomes and disease progression.16 Similarly, Bjoern et al linked non-responsiveness to ipilimumab in patients with melanoma to higher frequencies of MDSC and elevated IL6 expression.30 Our current results are consistent with and extend previous findings. First, it has been shown that in melanoma samples from patients, FOXD1 expression significantly positively correlated with IL6 expression (figure 4C). Second, we have revealed a direct regulatory influence of FOXD1 on IL6 expression, which was confirmed via ChIP-qPCR analysis (figure 4D). Furthermore, we were able to show that IL6 indeed acted as a downstream factor of FOXD1 that mediated T cell suppression via generating MDSC (figure 4H). These findings demonstrate that the FOXD1-IL6-MDSC axis plays a crucial role in shaping the immunosuppressive microenvironment in melanoma.
Having established a pivotal role of FOXD1 in melanoma pathogenesis, we sought strategies to inhibit its expression. Previous studies have highlighted the involvement of miR-581 dysregulation in cancer progression. Nabatchian et al reported the suppressive ability of miR-581 on oncoprotein MUC4 in gastric cancer.55 Additionally, miR-581 was found to be downregulated in hepatocellular carcinoma.56 In contrast, Zhao et al demonstrated a protumor role of miR-581 in colorectal cancer, suggesting that it could induce metastasis by regulating SMAD7.57 In our current investigation, various online databases predicted miR-581 as a potential regulator of FOXD1 (online supplemental figure 3A,B). Remarkably, we could show that melanoma cells treated with miR-581 mimics displayed a significant decrease in FOXD1 expression at both RNA and protein levels, leading to a significantly reduced capacity of melanoma cells to convert monocytes into MDSC (figure 5B,F). Additionally, the cond. med. from melanoma cells treated with miR-581 mimics exhibited a notably lower level of IL6 compared with the control with miRNA control mimics (figure 5D). These findings suggest that miR-581 may be a pivotal factor influencing the FOXD1-IL6-MDSC axis in the melanoma microenvironment.
Conclusion
Numerous in vitro and in vivo studies highlighted the abnormal elevation of FOXD1 expression across various tumor types. Moreover, this heightened FOXD1 expression has been linked to increased tumor growth and unfavorable prognosis. Our findings indicate that FOXD1 is involved in MDSC-mediated immunosuppression and here promotes tumor progression, suggesting FOXD1 as a potential novel therapeutic target in melanoma. However, additional in vivo studies are needed to examine the efficacy of FOXD1 suppression through potential inhibitors like miR-581 to improve the existing melanoma immunotherapies.
Data availability statement
Data are available upon reasonable request. All data relevant to the study are included in the article or uploaded as supplementary information. The raw data sets generated, used and analyzed during the current study are available from the corresponding author on reasonable request. The microarray data generated during the study are available from the GEO repository under the number GSE291167.
Ethics statements
Patient consent for publication
Ethics approval
Not applicable.
Acknowledgments
We thank Sayran Arif-Said and Diana Vobis for providing excellent technical assistance. We also acknowledge the DKFZ Genomics and Proteomics Core Facility for providing the Whole-Genome Expression Beadchips and related services. We thank the Flow Cytometry Unit of DKFZ for providing excellent technical assistance. We thank the Central Animal Laboratory of the German Cancer Research Center and Beijing Langke Biotech for their assistance with the in vivo experiments.
References
Footnotes
Contributors JSU: Guarantor; QS: conceptualization, methodology, formal analysis, investigation, writing—original draft, visualization, project administration; NW, JP, HW: methodology, investigation; MP: methodology, formal analysis, visualization; DN: writing—review and editing; FGOK, RB: methodology, formal analysis; YW, SP, RH, KW-H: writing—review and editing; SL, LG, YZ: methodology, investigation; VU: writing—review and editing, supervision; JSU: supervision, writing—review and editing; All authors read and approved the final manuscript.
Funding This work was funded by the Deutsche Forschungsgemeinschaft (DFG, German Research Foundation)—Project number 259332240/RTG 2099 to VU and JSU and Project number UT 112/1-1 to JSU.
Competing interests None declared.
Provenance and peer review Not commissioned; externally peer reviewed.
Supplemental material This content has been supplied by the author(s). It has not been vetted by BMJ Publishing Group Limited (BMJ) and may not have been peer-reviewed. Any opinions or recommendations discussed are solely those of the author(s) and are not endorsed by BMJ. BMJ disclaims all liability and responsibility arising from any reliance placed on the content. Where the content includes any translated material, BMJ does not warrant the accuracy and reliability of the translations (including but not limited to local regulations, clinical guidelines, terminology, drug names and drug dosages), and is not responsible for any error and/or omissions arising from translation and adaptation or otherwise.