Article Text

Abstract
Background Hepatocellular carcinoma (HCC) remains a leading cause of cancer-related deaths worldwide, especially in advanced stages where limited treatment options result in poor prognosis. The immunosuppressive tumor immune microenvironment (TIME), characterized by low immune cell infiltration and exhaustion, limits immunotherapy efficacy. To address this, our study investigates the role of C-C motif chemokine ligand 3 (CCL3) in modulating the HCC TIME.
Methods We analyzed CCL3 expression in human HCC samples from The Cancer Genome Atlas database, focusing on its correlation with inflammatory gene signatures and immune cell infiltration. High-dimensional single-cell RNA sequencing (scRNA-seq), flow cytometry, and multiplex immunofluorescence were used to investigate CCL3’s effects on macrophage function and T cell activation. The biological impact of CCL3 on macrophages was assessed using co-culture systems, confocal imaging, metabolite detection, and inhibition assays. Preclinical HCC models and ex vivo tumor fragment assays further explored how CCL3 modulates immune responses and enhances immune checkpoint blockade efficacy.
Results Our study shows that CCL3 is suppressed in the tumor microenvironment and positively correlates with immune infiltration and inflammatory responses. Targeted liver delivery of rAAV-Ccl3 reprograms the immune microenvironment in HCC, promoting immune cell recruitment and tertiary lymphoid structure formation, thus suppressing tumor growth via immune engagement. Through scRNA-seq, flow cytometry, and multiplex immunofluorescence, we found that CCL3 enhances macrophage antigen uptake and activates cytotoxic T cells. In vivo and in vitro experiments confirmed that CCL3 facilitates T cell infiltration and upregulates MHC II expression on macrophages, enhancing antigen presentation. The CCL3-CCR5 pathway also boosts macrophage metabolism, increasing lysosomal activity and antigen uptake, thereby strengthening adaptive immune responses and increasing sensitivity to immune checkpoint blockade therapies in preclinical models.
Conclusions This study highlights the pivotal role of CCL3 in reshaping the TIME and enhancing antitumor immunity in HCC. By promoting immune cell recruitment and enhancing antigen presentation, CCL3 demonstrates significant potential to improve the efficacy of immunotherapy, particularly in combination with immune checkpoint inhibitors. Targeting CCL3 may help to overcome the immunosuppressive TIME in HCC and improve patient outcomes.
- Hepatocellular Carcinoma
- Macrophages
- Tumor microenvironment - TME
- Major histocompatibility complex - MHC
- Immunotherapy
Data availability statement
Data are available in a public, open access repository. Data are available on reasonable request. All data relevant to the study are included in the article or uploaded as supplementary information. The raw sequence data from the bulk RNA-seq generated in this study have been deposited in the Gene Expression Omnibus (GEO) database under accession number GSE277065. The raw sequence data from the single-cell RNA-seq have been deposited in GEO under accession number GSE277066. Remaining data are available within the article, supplementary information, or source data file. Source data are provided with this paper.
This is an open access article distributed in accordance with the Creative Commons Attribution Non Commercial (CC BY-NC 4.0) license, which permits others to distribute, remix, adapt, build upon this work non-commercially, and license their derivative works on different terms, provided the original work is properly cited, appropriate credit is given, any changes made indicated, and the use is non-commercial. See http://creativecommons.org/licenses/by-nc/4.0/.
Statistics from Altmetric.com
- Hepatocellular Carcinoma
- Macrophages
- Tumor microenvironment - TME
- Major histocompatibility complex - MHC
- Immunotherapy
WHAT IS ALREADY KNOWN ON THIS TOPIC
Prior research has highlighted the role of chemokines like CCL3 in immune modulation, particularly in tumor microenvironments. However, the specific mechanisms by which CCL3 enhances antigen presentation and adaptive immune responses in hepatocellular carcinoma (HCC) have not been fully elucidated, necessitating further investigation into its therapeutic potential.
WHAT THIS STUDY ADDS
Our study reveals that CCL3 can induce the formation of tertiary lymphoid structures, reprogram macrophages, and enhance antigen presentation mechanisms mediated by the CCL3-CCR5 pathway, thereby improving adaptive immune responses. These mechanisms contribute to the inflammatory reprogramming of the tumor immune microenvironment.
HOW THIS STUDY MIGHT AFFECT RESEARCH, PRACTICE OR POLICY
The insights gained from this study may inform the development of innovative immunotherapeutic strategies combining CCL3 with immune checkpoint inhibitors. By elucidating CCL3’s role in enhancing the efficacy of cancer immunotherapies, this research could influence clinical approaches to HCC treatment and guide future studies in cancer immunotherapy.
Introduction
Hepatocellular carcinoma (HCC) exhibits a high global incidence and ranks as the third-leading cause of cancer-related mortality worldwide.1 The complex nature of the tumor immune microenvironment (TIME) significantly hampers the efficacy of conventional treatments.2–4 The suboptimal response to immune checkpoint blockade (ICB) therapy is primarily due to defects in tumor antigen recognition and presentation within the TIME, compounded by inadequate immune cell infiltration in solid tumors.5–7 Consequently, developing strategies to recruit and activate immune cells is essential for improving outcomes in HCC patients.8
Effective T cell enrichment in tumor regions and robust antigen presentation are critical for immune-mediated antitumor responses.9 However, the loss of tumor antigen expression and reduced MHC molecule recognition by tumor-associated macrophages impair antigen recognition and presentation.10 11 Moreover, tumors exhibiting immune desert or immune exclusion phenotypes often lack inflammatory gene expression, further restricting T cell infiltration and hampering the initiation and efficiency of adaptive immune responses.6 12 13 Therefore, approaches that enhance immune cell recruitment and augment antigen uptake and presentation by macrophages could significantly strengthen antitumor immune responses and improve responsiveness to immunotherapy.14 15
Preclinical studies have indicated that chemokines can promote the formation of tertiary lymphoid structures within tumors, recruit additional immune cells, and modify the TIME, thereby improving the efficacy of tumor immunotherapy.16–21 CCL3 (C-C motif chemokine ligand 3), also known as macrophage inflammatory protein-1α (MIP-1α), is a chemokine ligand of the CC family that primarily mediates inflammation and immune cell trafficking in tumors.22 23 Macrophages exhibit considerable heterogeneity and plasticity, and therapies that induce macrophage phenotype switching or enhance proinflammatory polarization have proven effective.21 However, it is not yet clear whether CCL3 can modulate macrophage function within tumors. Although CCL3 can induce inflammation, its role in the complex tumor microenvironment (TME) remains uncertain and warrants further investigation to elucidate its impact on tumor adaptive immune responses.
This study examines CCL3 expression in human solid tumors and its correlation with inflammatory genes and immune cell infiltration in liver cancer. We also investigate whether CCL3 can enhance antitumor efficacy in preclinical HCC models. Our findings indicate that CCL3 boosts immune cell infiltration and function within the TIME and facilitates the formation of tertiary lymphoid structures. Through high-dimensional single-cell RNA sequencing (scRNA-seq), multiparameter flow cytometry, and multiplex immunofluorescence analyses, we reveal that CCL3 recruits immune cells such as T cells and enhances macrophage-mediated antigen phagocytosis and presentation, thereby amplifying T cell effector functions and cytolytic activity. Furthermore, multiple preclinical HCC models and ex vivo tumor fragment platforms were used to elucidate the mechanisms by which CCL3 enhances tumor-infiltrating lymphocyte (TIL) quantity and functionality via macrophages. This research provides novel insights and preclinical evidence supporting strategies to improve tumor immunotherapy.
Results
CCL3 expression and immune infiltration in liver cancer
Recent research highlights the proinflammatory characteristics of CCL3.24 A systematic analysis of CCL3 expression in tumors using The Cancer Genome Atlas (TCGA) dataset revealed that its expression is suppressed in liver cancer, breast cancer, and non-small cell lung cancer, suggesting that the TME may inhibit the function of this inflammatory chemokine (figure 1a). Further analysis showed a significant positive correlation between CCL3 expression and immune-inflammatory markers such as CD8A, CD8B, GZMB, and TNFRSF18 (figure 1b, online supplemental figure 1a). To determine whether CCL3 is a major factor contributing to the deficiency of lymphocyte chemokines, we analyzed the expression of chemokines in human liver cancer samples using data from the TCGA-LIHC database. Our analysis primarily focused on the CCL and CXCL chemokine families associated with tumor immunity. The results revealed that, while the expression of these chemokines is generally upregulated in liver cancer compared with normal tissues, CCL3 expression is significantly suppressed in liver cancer (online supplemental figure 2a). We then validated the effects of these chemokines using recombinant proteins in a syngeneic mouse model of liver cancer, such as CXCL9, CXCL10, and CXCL13. Our results indicated that the effects of CCL3 were significantly more pronounced than those of the other chemokines (online supplemental figure 3a,b). In the TCGA-LIHC samples with high CCL3 expression, CCL3 levels were positively correlated with immune cell gene expression and with macrophage and T cell infiltration, indicating that CCL3 may be involved in regulating the inflammatory immune microenvironment (online supplemental figure 1b). Additionally, analysis of the TCGA-LIHC dataset showed that HCC patients with high CCL3 expression exhibited higher immune checkpoint levels, suggesting a potential increased response to ICB therapy (figure 1c). Using the Tumor Immune Dysfunction and Exclusion method, we assessed the clinical immunotherapy potential of different CCL3 subgroups, finding that the high CCL3 expression subgroup scored higher (figure 1d). These findings suggest that CCL3 may enhance tumor immunotherapy by reshaping the inflammatory immune microenvironment.
Supplemental material

CCL3 expression and its impact on immune response and tumor growth. (a) Expression levels of the CCL3 gene in tumor and normal tissues across hepatocellular carcinoma (HCC), non-small cell lung carcinoma (NSCLC), and breast cancer (BC). (b) Scatter plot illustrating the correlation between CCL3 expression and inflammatory response scores. Two-tailed Spearman correlation coefficients are presented. (c) Expression levels of immune checkpoint genes in CCL3 high-expression and low-expression HCC tissue samples. ***p<0.001 indicates statistical significance. (d) Distribution of immune response scores in different groups based on predictive results. **p<0.01. (e) Six-week-old C57BL/6J or NCG mice treated with recombinant CCL3 protein or PBS (n=6 per group). (f) Tumor growth curves of Hepa1-6 liver cancer cells subcutaneously inoculated into C57BL/6J or NCG mice (n=6 per group). One of three independent experiments with similar results is shown. Tumor weight of C57BL/6J mice in the PBS and CCL3 groups (n=6 per group). (g) Six-week-old C57BL/6J mice treated with rAAV6-Ccl3, rAAV6-NC, or PBS (n=6 per group). (h) Tumor growth curves of Hepa1-6 liver cancer cells subcutaneously inoculated into C57BL/6J mice (n=6 per group). Tumor weight comparison between rAAV6-Ccl3, rAAV6-NC, and PBS groups (n=6 per group). (i) Tumor analysis of subcutaneous tumors in 6-week-old C57BL/6J mice treated with rAAV6-Ccl3 or rAAV6-NC (n=6 per group). (j) Six-week-old C57BL/6J mice treated with rAAV8-Ccl3, rAAV8-NC7 (n=6 per group). (k) Kaplan-Meier survival curves of C57BL/6J mice with in situ liver tumors (n=3 per group). (l) Live bioluminescence imaging of C57BL/6J mice subcutaneously inoculated with luciferase-labeled Hepa1-6 cells. On day 15, luminescence signals were measured using the IVIS Lumina II imaging system, and luminescence intensity was compared between the rAAV8-CCL3 and rAAV8-NC groups (n=3 per group). (m) H&E and Ki67 staining of liver tumor sections from C57BL/6J mice, scale bars: 500 µm and 100 µm, respectively (n=3 mice). (n) Representative in vivo bioluminescence imaging of C57BL/6J mice subcutaneously inoculated with Hepa1-6 cells labeled with luciferase. Significance between groups was assessed using the two-tailed unpaired Student’s t-test or the Wilcoxon test, as appropriate. Data are presented as mean±SD. P values ≤0.05 were considered statistically significant. Box-whisker plots represent the IQR from the first to the third quartile, with the median indicated by the center line. Whiskers extend from the first and third quartiles to the minimum and maximum values within 1.5×IQR. ns p>0.05, **p<0.01, ***p<0.001, ****p<0.0001.PBS group was treated with phosphate-buffered saline(PBS) as the control group.
Overexpression of CCL3 inhibits tumor growth in mice
To elucidate the role of CCL3 in tumor progression, we employed four liver cancer mouse models: Hepa1-6 subcutaneous, H22 subcutaneous, Hepa1-6 orthotopic, and luciferase-labeled Hepa1-6 orthotopic tumor models (Luc-Hepa1-6 HCC model). In the Hepa1-6 subcutaneous model, recombinant CCL3 protein significantly inhibited tumor growth, reducing both tumor volume and mass. This antitumor effect was absent in immunodeficient mice, suggesting that CCL3’s action is mediated by immune cells (figure 1e,f). To enable sustained CCL3 expression for long-term observation, we developed an adeno-associated virus (AAV) vector (online supplemental figure 1c–f), which similarly demonstrated significant antitumor effects in the Hepa1-6 subcutaneous tumor model (figure 1g–i). To evaluate the specificity and stability of recombinant AAV (rAAV)-mediated liver-targeted delivery of CCL3, we performed immunofluorescence analysis to examine the expression levels of the virus in multiple organs, including the heart, liver, spleen, lungs, kidneys, and colons of mice (online supplemental figure 4a). Furthermore, quantitative PCR was used to measure Ccl3 mRNA expression levels (online supplemental figure 4b), and ELISA was employed to determine CCL3 protein concentrations in these organs (online supplemental figure 4c). The results confirmed that rAAV-mediated delivery achieved stable and liver-specific expression of CCL3 with minimal off-target effects. In the orthotopic model, the liver-targeted rAAV8-Ccl3 vector also exhibited robust tumor suppression (figure 1j,k). The combination of serotype AAV8 and TBG promoter can target the liver and liver cells for gene editing.25 In vivo observation of small animals showed significant relief of in situ liver cancer tumors labeled with luciferase compared with the control group (figure 1n,l). Pathological analysis revealed decreased proliferative capacity in rAAV8-Ccl3-treated tumors as evidenced by Ki-67 staining (figure 1m). In vitro assays confirmed that CCL3 does not directly inhibit tumor cell proliferation (online supplemental figure 1g), suggesting that its antitumor effects are primarily mediated through immune modulation.
CCL3 remodels the immune microenvironment of liver cancer
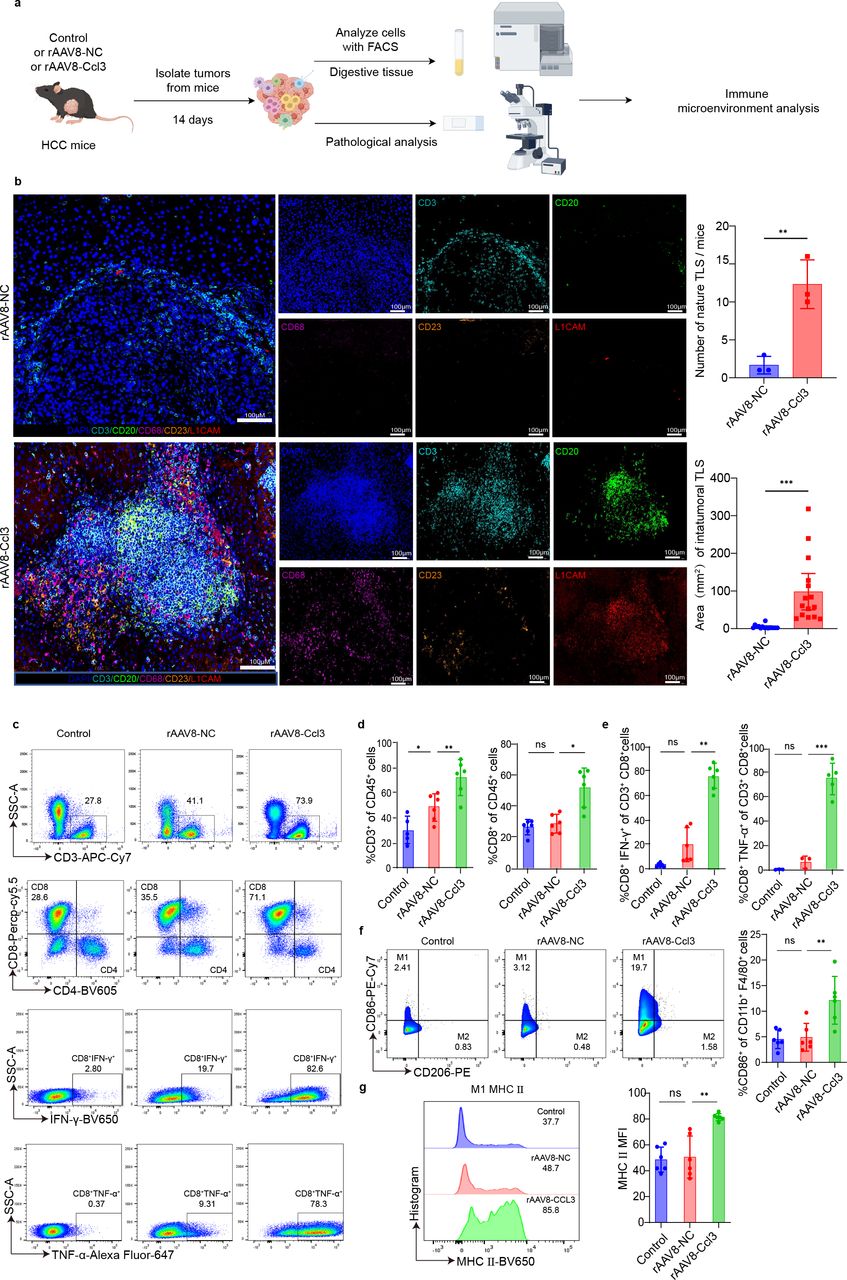
Given that CCL3 has been shown to participate in immune-mediated tumor suppression, we hypothesized that CCL3 could induce an inflammatory immune microenvironment (figure 2a). Multiplex immunofluorescence analysis on mouse tumor tissue sections demonstrated that CCL3 significantly enhanced the formation of tertiary lymphoid structures, characterized by the aggregation of T cells and B cells along with increased macrophages and dendritic cells. Existing research suggests that the formation of tertiary lymphoid structures represents the occurrence of inflammation and immune infiltration and is associated with better prognosis.17 18 26 The number and maturation of these tertiary lymphoid structures were markedly greater in the CCL3-treated group (figure 2b). Multicolor flow cytometry analysis further showed that CCL3 increased the infiltration of CD3+ T cells and the number of CD8+ T cells (figure 2c,d), as well as the release of cytotoxic factors such as IFN-γ and TNF-α from CD8+ T cells (figure 2e). Additionally, there was an increase in the M1 macrophage phenotype and a higher fluorescence intensity of MHC-II molecules on M1 macrophages, indicating that CCL3 promotes antitumor immune activation (figure 2f,g). Although other immune cell types were assessed, the primary effects of CCL3 were observed in macrophages and T cells, consistent with previous studies (online supplemental figure 6b).22 These results suggest that CCL3 enhances T cell recruitment and cytotoxicity, promotes macrophage polarization to an M1-like inflammatory phenotype, and increases MHC-II expression on macrophages.

CCL3 remodels the immune microenvironment of liver cancer. (a) Schematic diagram outlining the experimental workflow for multiplex immunofluorescence and high-dimensional flow cytometry analysis of mouse tumor tissue. (b) Multiplex immunofluorescence images (monochrome and merged) showing DAPI, CD3, CD20, CD68, CD23, and LICAM in situ liver tumors. Scale bar, 100 µm. (c) Representative flow cytometry plot based on the analysis of immune cells within mouse tumors. (d) Quantitative analysis of tumor-infiltrating CD3+ and CD8+ T cells based on flow cytometry in rAAV8-Ccl3, rAAV8-NC, or PBS-treated mice (n=5–6 mice per group). (e) Quantitative analysis of CD8 expression in tumor-infiltrating T cells in rAAV8-Ccl3, rAAV8-NC, or PBS-treated groups (n=5–6 mice per group). (f) Quantification of IFN-γ and TNF-α expression in CD8+T cells infiltrating tumors from rAAV8-Ccl3, rAAV8-NC, or PBS-treated groups using flow cytometry (n=5–6 mice per group). (g) Quantification of CD86+ macrophages infiltrating tumors from rAAV8-Ccl3, rAAV8-NC, or PBS-treated groups, based on flow cytometry (n=5–6 mice per group). Representative flow cytometry plots and quantification of the mean fluorescence intensity of MHC II molecules in tumor-infiltrating M1 macrophages from rAAV8-Ccl3, rAAV8-NC, or PBS-treated mice (n=5–6 mice per group). Statistical significance between groups was assessed using the two-tailed unpaired Student’s t-test or the Wilcoxon test, as appropriate. Data are presented as mean±SD. P values ≤0.05 were considered statistically significant. Box-whisker plots represent the IQR from the first to the third quartile, with the median indicated by the center line. Whiskers extend from the first and third quartiles to the minimum and maximum values within 1.5×IQR. ns p>0.05, *p<0.05, **p<0.01, ***p<0.001.PBS group was treated with phosphate-buffered saline(PBS) as the control group.
scRNA-seq analysis of CCL3-induced inflammatory immune landscapes
To elucidate the characteristics of the immune microenvironment at a single-cell resolution, we conducted a single-cell transcriptomic analysis of the TME in a Hepa1-6 orthotopic liver cancer mouse model (figure 3a). From six tumor samples (WT n=3; CCL3 n=3), we obtained a total of 67,962 cells. Unsupervised clustering and UMAP dimensionality reduction analysis identified 12 distinct cell types (figure 3b, online supplemental figure 8a–c). Notably, the proportion of T cells was increased in the CCL3 group compared with the control group, consistent with our previous observations (figure 3c,d, online supplemental figure 8d).

Single-cell RNA sequencing (scRNA-seq) analysis of CCL3-induced inflammatory immune landscapes. (a) Schematic diagram illustrating the workflow for scRNA-seq experiments. (b) Uniform manifold approximation and projection (UMAP) plots of 67,962 cells isolated from mouse cancer tissue, from CTRL (n=3 biologically independent samples) and CCL3 treatment groups (n=3 biologically independent samples). Each cell is color-coded by cell type. (c) Distribution of cells across different populations. (d) Heatmap showing the abundance of each immune cell subpopulation in CTRL and CCL3 groups. (e) UMAP plot of T cell subpopulations, color-coded by cell cluster, cell type, and sample group, accompanied by a bar chart depicting the proportion of T cell subpopulations. (f) Pathway enrichment analysis revealing upregulated pathways of differentially expressed genes in T effector cells compared with other T cell subpopulations. (g) UMAP plot of monocyte and macrophage subpopulations, color-coded by cell cluster, cell type, and sample group. (h) Display a statistical chart of macrophage subpopulation distribution. (i) Violin plot showing the expression levels of selected genes in macrophage subpopulations. (j) Pseudotime analysis predicting the developmental trajectory of specific cell clusters. (k) Pathway enrichment analysis illustrating upregulated pathways of differentially expressed genes in specific macrophage subgroups compared with other macrophage subgroups. (l) Bubble plot highlighting enriched intercellular communication pathways between specific cell clusters.
Further reclustering of T cell and NK cell subsets revealed 15 distinct clusters, with the CCL3 group showing a significant increase in effector T cells relative to the control group (figure 3e, online supplemental figure 9a–d). GO enrichment analysis indicated upregulation of pathways involved in leucocyte activation and adhesion in the CCL3 group, further supporting the role of CCL3 in promoting an inflammatory TME (figure 3f).
Subsequent analysis of monocytes and macrophages identified nine clusters, including five macrophage subtypes: proliferative TAMs (C1), FN1+ macrophages (C2), VSIG4+APOC1+ macrophages (C3), PTGST2+NOS2+ macrophages (C4), and an undefined macrophage cluster (C5). Additionally, a monocyte cluster (C6) and three dendritic cell clusters (C7, C8, C9) were identified (figure 3g). The C4 macrophage cluster was notably expanded in the CCL3 group compared with controls.
The analysis of the expression profiles of five macrophage markers (Ptgs2, Nos2, Slamf7, Cxcl9, H2-Eb1) showed an increase in the expression of C4 cluster Ptgst2, Slamf7, and Nos2, as well as inflammation-related Cxcl9 and MHC class II complex-related H2-Eb1, which are key factors in inflammation and phagocytosis, further supporting this feature. GO enrichment analysis showed that the CCL3 group upregulated pathways related to cytokine production, leucocyte activation, migration and adhesion, inflammation, phagocytosis, and lysosome formation, emphasizing the role of CCL3 in driving macrophage-mediated inflammation (figure 3i,k).
To assess the impact of CCL3 on C4 cluster formation (S105a), we performed pseudotime analysis ((figure 3j, online supplemental figure 10c). The results indicate a directional migration of monocytes toward the C4 cluster, suggesting that CCL3 drives this terminally differentiated cell subset. Furthermore, intercellular communication between the C4 cluster and T cell subsets predominantly occurs via the CXCL9/CXCL10-CXCR3 pathways, which are pivotal in activating inflammatory responses and adaptive immunity (figure 3l). In summary, CCL3 not only recruits effector immune cells but also drives macrophages toward inflammatory and phagocytic phenotypes, promoting the inflammatory reprogramming of the TME.
CCL3 enhances macrophage antigen presentation and facilitates T cell recruitment
We further investigated the immune cells driving the observed antitumor immune response. In mouse models, we noted a significant increase in the infiltration of macrophages and tumor-infiltrating lymphocytes (TILs) within the tumors. We first assessed whether CCL3 has a direct effect on T cells (figure 4a). By isolating macrophages from mouse bone marrow and T cells from the Peripheral blood, we found that CCL3 can chemotactically recruit T cells but does not promote their proliferation or activation (figure 4b, online supplemental figure 1g). The increased expression of MHC-II molecules on macrophages observed in vivo led us to hypothesize that CCL3 might enhance macrophage antigen phagocytosis and presentation. In vitro phagocytosis assays confirmed that CCL3 boosts macrophage phagocytic activity (figure 4c). To determine if CCL3 enhances the ability of macrophages to stimulate allogeneic T cells, we co-cultured Hepa1-6 tumor cells, macrophages, and T cells in defined ratios. Flow cytometry showed increased IFN-γ expression in T cells, which was not observed in the absence of macrophages. This effect was also blocked by MHC antibodies (figure 4d,e). At the same time, CCL3 enhanced the killing ability of T cells against tumor cells through macrophages (figure 4f, online supplemental figure 7c). This also confirms our analysis using flow cytometry and single-cell sequencing technology, which found that macrophages transform into proinflammatory subtypes and enhance antigen phagocytic presentation function. These findings indicate that CCL3 not only effectively recruits T cells but also enhances their cytotoxicity against tumor cells by improving macrophage antigen presentation.

CCL3 enhances macrophage antigen presentation and facilitates T cell recruitment. (a) Experimental setup for isolating mouse macrophages and T cells. (b) Representative image (left) and quantitative analysis (right) of mouse T cell migration through a Transwell chamber. (c) Representative image (left) and quantitative analysis (right) of macrophage phagocytic activity, with green indicating cell viability and red indicating phagocytosis of fluorescent latex particles. (d) Co-culture experiments involving macrophages, T cells, and tumor cells to assess the expression levels of IFN-γ, CD107a, and TNF-α in CD3+T cells, shown through representative flow cytometry plots and quantitative analysis. (e) Schematic diagram of T cell killing device. (f) Quantitative analysis of cytotoxicity against Hepa1-6 tumor cells transfected with a GFP tag, based on experiments with n=3 or 6 mice. Statistical significance between groups was assessed using the two-tailed unpaired Student’s t-test or the Wilcoxon test, as appropriate. Data are presented as mean±SD. p values≤0.05 were considered statistically significant. Box-whisker plots represent the IQR from the first to the third quartile, with the median indicated by the center line. Whiskers extend from the first and third quartiles to the minimum and maximum values within 1.5×IQR. ns p>0.05, *p<0.05, **p<0.01, ****p<0.0001.
CCL3 enhances antigen uptake and presentation by macrophages through CCR5-mediated metabolic reprogramming
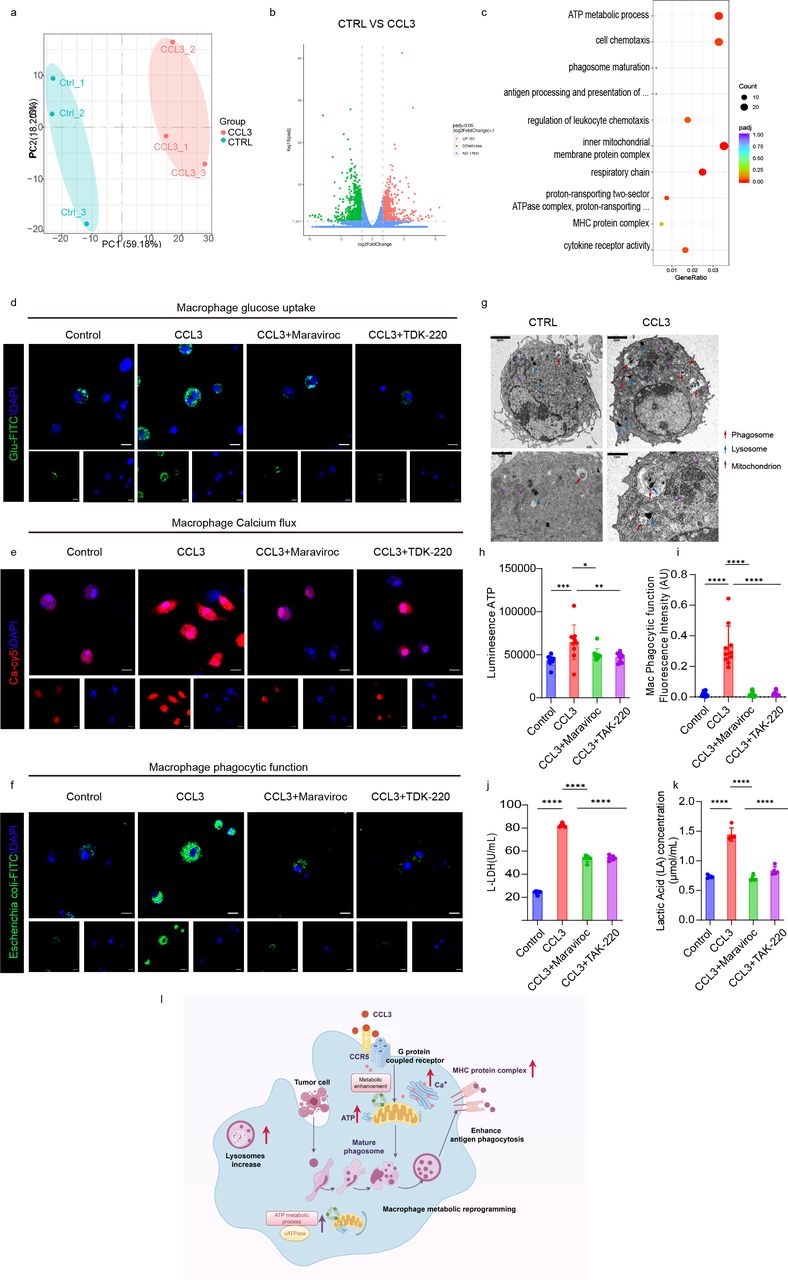
Transcriptomic analysis of macrophages revealed that CCL3 significantly upregulates pathways related to macrophage function (figure 5a–c). We further examined the effects of CCL3 on macrophages using transmission electron microscopy (figure 5g). Compared with the control group, bone marrow-derived macrophages in the CCL3-treated group exhibited increased formation of phagosomes and a higher number of lysosomes and mitochondria.

CCL3 enhances antigen uptake and presentation by macrophages through CCR5-mediated metabolic reprogramming. (a) Transcriptomic analysis of differentially expressed genes between CTRL and CCL3 treatment groups in macrophages, visualized through principal component analysis (PCA). (b) Volcano plot showing differentially expressed genes in mouse macrophages between CTRL and CCL3 groups. (c) Enrichment analysis of upregulated pathways in differentially expressed genes in mouse macrophages from the CCL3 group compared with the CTRL group. (d) Confocal microscopy analysis of glucose uptake in mouse macrophages treated with recombinant CCL3 protein and CCR5 inhibitor. (e) Confocal microscopy analysis of calcium ion release in mouse macrophages treated with recombinant CCL3 protein and CCR5 inhibitor. (f) Confocal microscopy analysis of phagocytic function in mouse macrophages treated with recombinant CCL3 protein and CCR5 inhibitor. (g) Transmission electron microscopy images of mouse macrophages treated with WT or recombinant CCL3 protein. Red arrows indicate phagosomes, blue arrows indicate lysosomes, and purple arrows indicate mitochondria. One of three representative experiments with similar results is shown. (h) Quantitative analysis of ATP levels in mouse macrophages following treatment with recombinant CCL3 protein and CCR5 inhibitor. (i) Quantitative analysis of phagocytic function in mouse macrophages treated with recombinant CCL3 protein and CCR5 inhibitor. (j) Quantitative analysis of lactate dehydrogenase (LDH) activity in mouse macrophages treated with recombinant CCL3 protein and CCR5 inhibitor. (k) Quantitative analysis of lactate levels in mouse macrophages following treatment with recombinant CCL3 protein and CCR5 inhibitor. (l) Schematic representation of how CCL3-mediated CCR5 signaling enhances antigen presentation through metabolic reprogramming in macrophages. Statistical significance between groups was assessed using the two-tailed unpaired Student’s t-test or the Wilcoxon test, as appropriate. Data are presented as mean±SD. P values ≤0.05 were considered statistically significant. Box-whisker plots represent the IQR from the first to the third quartile, with the median indicated by the center line. Whiskers extend from the first and third quartiles to the minimum and maximum values within 1.5×IQR. ns p>0.05, *p<0.05, **p<0.01, ***p<0.001, ****p<0.0001.
Additionally, IFN-γ signaling, a known macrophage polarization factor, influences the proinflammatory phenotype, resulting in increased expression of MHC-II in a substantial proportion of cells.27 CCL3 primarily exerts its effects through the CCR5 receptor.28 Previous studies have indicated that CCR5-mediated signaling is essential for the activation of most macrophages, with CCR5 functioning as a G-protein coupled receptor that activates intracellular calcium release and enhances metabolism.24 29–31 To explore how CCL3 affects macrophages in the presence of the CCR5 inhibitor maraviroc and TDK-220, we performed in vitro co-culture experiments.32 33 These experiments revealed that CCL3 significantly enhances macrophage glucose uptake, calcium release, and phagocytic activity (figure 5d–f). However, these effects were inhibited by the CCR5 inhibitor. We also observed a significant increase in key metabolic markers such as ATP, lactate, and lactate dehydrogenase, which were similarly influenced by CCR5(figure 5h-k). These results elucidate how CCL3 acts on macrophages and induces inflammatory reprogramming. In summary, CCL3 enhances macrophage metabolism and further promotes antigen uptake and presentation through the CCR5 receptor (figure 5l).
CCL3 targets macrophages and collaborates with T cells to suppress tumor growth
To further validate this effect, we used clodronate liposomes to deplete macrophages in the Hepa1-6 liver cancer mouse model (figure 6a,c). This depletion resulted in the loss of CCL3’s antitumor effect (figure 6b,d). These findings indicate that CCL3 enhances macrophage antigen uptake and phagocytosis, which in turn stimulates the antitumor response of T cells. Additionally, depleting CD8+and CD4+ T cells in the liver cancer mouse model led to uncontrolled tumor growth, suggesting that CCL3 suppresses tumor growth by promoting the collaboration between macrophages and T cells (figure 6e,f). To investigate the spatial interaction between T cells and macrophages in the TME, we performed multiplex immunofluorescence staining (figure 6g). Quantitative analysis showed that CCL3 significantly enhances the spatial interaction between macrophages and T cells and increases the ability of T cells to release IFN-γ (figure 6h). In an in vitro model, we used a transwell system, placing macrophages in the upper chamber and T cells and tumor cells in the lower chamber to simulate this interaction. In a separate setup, we co-cultured macrophages, T cells, and tumor cells to assess the impact of CCL3 on T cell function. We observed that CCL3 was required to enhance T cell IFN-γ release when macrophages and T cells were in contact (figure 6i). In summary, these results demonstrate that CCL3 targets macrophages and T cells to cooperate in suppressing tumor growth, promotes their spatial interaction, and enhances T cell cytotoxicity.

CCL3 targets macrophages and collaborates with T cells to suppress tumor growth. (a) Experimental setup for treating 6-week-old C57BL/6J mice with rAAV6-NC or rAAV6-CCL3 (n=6 mice per group) and depleting macrophages with clodronate liposomes. (b) Treat 6-week-old C57BL/6J mice (n=6 mice per group) with rAAV6-NC or rAAV6-CCL3 and record the tumor growth of macrophages depleted with clodronate liposomes, as well as observe the weight of the endpoint tumor. (c) Experimental setup for treating 6-week-old C57BL/6J mice with rAAV6-NC or rAAV6-CCL3 (n=6 mice per group) and blocking MHC II molecules. (d) Treat 6-week-old C57BL/6J mice (n=6 mice per group) with rAAV6-NC or rAAV6-CCL3 and block the tumor growth of MHC II molecules. Record and observe the weight of the endpoint tumor. (e) Experimental setup for treating 6-week-old C57BL/6J mice with rAAV6-NC or rAAV6-CCL3 (n=6 mice per group) and blocking CD4 and CD8 T cells. (f) Treat 6-week-old C57BL/6J mice (n=6 mice per group) with rAAV6-NC or rAAV6-CCL3 and record the tumor growth and observe the weight of the endpoint tumor after depletion of CD4 and CD8 T cells. (g) Schematic diagram of spatial interactions between macrophages and T cells. (h) Spatial distribution and quantitative analysis of macrophages, T cells, and IFN-γ in mouse liver cancer tissue using multiplex immunofluorescence. (i) In vitro contact stimulation assays involving macrophages, T cells, and Hepa1-6 tumor cells. Macrophages were separated in a Transwell chamber to prevent direct cell-cell contact. T cells and Hepa1-6 tumor cells were added to the lower chamber. “+” indicates contact, “−” indicates no contact. Representative flow cytometry plots and quantitative analysis of IFN-γ secretion by T cells are shown. (j) Experimental setup for treating 6-week-old C57BL/6J mice with rAAV6-NC or rAAV6-CCL3 (n=5 mice per group) and combined PD-1 or CTLA-4 antibody treatment. Tumor growth curves are shown, with data representing one of three representative experiments. Tumor weights at the endpoint are recorded (n=5 mice per group). Statistical significance between groups was assessed using the two-tailed unpaired Student’s t-test or the Wilcoxon test, as appropriate. Data are presented as mean±SD. P values ≤0.05 were considered statistically significant. Box-whisker plots represent the IQR from the first to the third quartile, with the median indicated by the center line. Whiskers extend from the first and third quartiles to the minimum and maximum values within 1.5×IQR. ns p>0.05, *p<0.05, **p<0.01, ***p<0.001, ****p<0.0001. AAV, adeno-associated virus; rAAV, recombinant AAV.
Finally, we analyzed the differences between HCC patients with high and low CCL3 expression in the human TCGA database. GO and KEGG enrichment analyses revealed that the CCL3 high expression group exhibited significant upregulation of macrophage and T cell activation in adaptive immune responses, cell migration and adhesion, and MHC complex expression (online supplemental figure 11a–c). These findings suggest that CCL3 has the potential to reverse the suppressive immune microenvironment. Additionally, when combined with PD-1 and CTLA-4 immune checkpoint blockade therapies, CCL3 significantly enhanced the therapeutic efficacy, further underscoring its potential in antitumor immunotherapy and clinical translation (figure 6j).
Discussion
This study reveals that CCL3 promotes the transformation of the TME into an inflammatory phenotype, recruits T cells into the TME, and enhances macrophage antigen presentation, thereby improving the antitumor efficacy of T cells.34–36 Significant advancements have been made in cancer immunotherapy with immune checkpoint inhibitors and CAR-T cell therapies.37 38 However, T cell-targeted immunotherapies often face challenges in many malignant tumors.36 39 Solid tumors frequently exhibit poor T cell infiltration and a high proportion of exhausted TILs, which fail to effectively eradicate tumor cells.15 21 This is further supported by evidence that a lack of cooperation between lymphocytes and myeloid cells may be a key factor in the failure of tumor immunotherapy.40 41 We demonstrated that CCL3 not only recruits immune cells and targets macrophages via CCR5 to enhance their antigen presentation capabilities, but also induces the formation of tertiary lymphoid structures within the tumor, reinforcing the idea that CCL3 can induce an inflammatory TME.42 Research suggests that the presence of tertiary lymphoid structures is also linked to better clinical outcomes.23 43 44
Under normal physiological conditions, antigen-presenting cells (such as macrophages) activate antigen-specific T cells through antigen presentation and costimulatory signals, driving systemic immune responses. However, myeloid cells infiltrating solid tumors often display immunosuppressive or tumor-promoting traits. CCL3 primarily uses CCR5 as its receptor.28 45 Binding of CCL3 to CCR5 induces conformational changes in the receptor, activating G proteins and promoting endogenous calcium release, cell proliferation, and migration. Despite limited research on CCR5’s role in macrophages, our findings indicate that CCL3 enhances macrophage energy metabolism, antigen phagocytosis, and presentation via CCR5.46 These effects are inhibited by CCR5 antagonists.47 48 Thus, CCL3 can reprogram macrophages to create an anti-TIME. Our study highlights that targeting and reversing the suppressive immune microenvironment within tumors can enhance adaptive immune responses, transforming immune “cold” tumors into immune “hot” tumors. Combined with immune checkpoint therapies, this approach may further bolster antitumor immune responses.49 50
While alternative delivery systems, such as liposomal nanoparticles (LNPs) and aptamers, show promise for gene therapy and cancer immunotherapy, each has limitations that influenced our choice. LNPs, for example, have lower stability in sustaining long-term gene expression and may induce immune responses, complicating therapeutic applications. Although aptamers are highly specific, they do not support sustained gene expression, which is critical for research requiring long-lasting immune effects, as in our study. In contrast, AAV offers safe, sustained, and targeted gene expression, making it particularly valuable when continuous regulation of the TME is required.
In our study, we used a mouse model to investigate the immune-modulatory effects of CCL3 and its antitumor efficacy. This model was chosen because the mouse liver cancer model closely approximates the liver cancer immune microenvironment, providing a robust platform to explore immune cell interactions and functions. While humanized mouse models and patient-derived organoids offer more human-relevant platforms, they also have limitations. Humanized mice, for instance, can partially mimic the human immune system, mainly through human T cells, but their immune system still differs from that of humans, making it difficult to establish a fully functional and complex immune system. Similarly, organoid models are useful for mimicking the TME, but they have limitations in simulating immune cell infiltration and function, and they are technically demanding and costly. Given these considerations, the syngeneic mouse liver cancer model remains a practical and effective tool for studying liver cancer.
Current immunotherapy strategies often address only one or a few key aspects of tumor immune escape, leading to limited tumor-killing efficacy, treatment resistance, and tumor recurrence. Our research clarifies that CCL3 can simultaneously activate multiple steps of the antitumor immune response, including enhancing phagocytic activity, MHC molecule expression for antigen presentation, and rapid recruitment and activation of T cells. Therefore, CCL3 can restore adaptive immune responses through TME reprogramming, effectively eliminating solid tumors and establishing lasting immune memory. We validated these findings using data from the human TCGA database, demonstrating that combining CCL3 with immune checkpoint inhibitors holds significant potential and clinical promise. Overall, overexpressing CCL3 in solid tumors may represent a novel strategy to optimize solid tumor immunotherapy and enhance immune checkpoint blockade therapy by reprogramming TIME.
Methods
Mice
Six-week-old male C57BL/6J, Balb/c, and NOD CRISPR Prkdc IL2r (NCG) mice were obtained from GemPharmatech (Jiangsu, China) and housed under controlled conditions with a 12-hour light/dark cycle, with ad libitum access to standard chow and water.
Tumor model
Hepa1-6 cells (5×10∧5) were subcutaneously injected into the flanks of C57BL/6J mice in 0.2 mL PBS(phosphate-buffered saline). Tumor volume was calculated as long diameter×short diameter²/2 and plotted against time to create growth curves. A tumor volume exceeding 1500 mm³ was considered an event in survival experiments. For in vivo imaging, tumor cells were labeled with luciferase, and mice were anesthetized with isoflurane, followed by 15 mg/kg D-luciferin sodium salt (Promega) intraperitoneally. Imaging was performed 10 min later using the IVIS Lumina II system.
Cell lines and cell culture
Hepa1-6 (Procell), Hepa1-6-Luc, H22 (Procell), and 293 T cells (Procell) were cultured in DMEM (Gibco) with 2 mM glutamine, 1% penicillin–streptomycin, and 10% FBS. Hepa1-6-Luc cells were generated by transducing Hepa1-6 with a lentivirus encoding luciferase. Mycoplasma testing confirmed no contamination. Cells were maintained at 37°C and 5% CO2.
Mouse primary PBMCs and T cells were cultured in RPMI (Gibco) supplemented with 2 mM glutamine, recombinant IL-2 (25 U/mL), 1% penicillin–streptomycin, and 10% FBS (fetal bovine serum). Bone marrow was obtained from the femur and tibia of C57BL/6J mice aged 8–10 weeks and cultured in DMEM with 10% FBS, M-CSF (macrophage colony-stimulating factor) (10 ng/mL), penicillin, and streptomycin.
Drug administration
From randomization until euthanasia, when tumor size reached 50 mm³, mice received vector control and recombinant CCL3, CXCL9, CXCL10, or CXCL13 (500 µg/mouse) every 3 days. For intertumoral administration, vector control and rAAV6-Ccl3 were given every 4 days. In situ administration also involved rAAV8-Ccl3 every 4 days.
Starting 1 day before CCL3 treatment, mice received intraperitoneal injections of anti-CTLA4 (BioXcell, 9H10, 40 µg/mouse) and anti-PD-1 (BioXcell, RMP1-14, 200 µg/mouse) antibodies twice weekly, along with anti-MHC II antibodies (BioXcell, Y-3P, 500 µg/mouse). Corresponding isotype controls were injected as appropriate.
Use of AAV
rAAV-Ccl3 was administered to mice at a dosage of 1×10¹² vg/mice. For each administration, the volume of AAV used was 100 μL/mouse. The delivery was primarily carried out via tail vein injection for systemic distribution, with tumor injection employed in some cases to directly target the tumor site.
In vivo depletion of T cells and macrophages
For CD8 T cell depletion, mice were injected with 500 µg of monoclonal antibody 53–6.7 (BioXCell) or control IgG 1 day before CCL3 treatment, followed by 150 µg weekly. For CD4 T cell depletion, 500 µg of anti-mouse CD4 antibody (GK1.5, BioLegend) was administered similarly. Macrophages were depleted using chlorophosphonate liposomes (150 µL at 7 mg/mL) every 3 days starting 2 days before treatment.
Flow cytometry
Tumor tissue was minced and digested in a solution containing 10 mM HEPES, 1 mg/mL collagenase V, Deoxyribonuclease I, neutral protease, and antibiotics. The dissociated cells were used for FACS analysis. For in vitro cultures, samples were collected for T cell proliferation and activation analysis. Antibodies used are listed in online supplemental table 1, with procedures following BD LSRFortessa standards and data analyzed with FlowJo software.
Multiplexed immunofluorescence assay
To visualize cell composition and spatial localization, multiple immunofluorescence and multispectral imaging were performed on FFPE slides using the PANO Multiplex IHC kit (Panovue) to detect CD3, CD20, CD23, CD68, CD11b, L1CAM, and IFN-γ, following standard protocols and generating multispectral images with the Mantra system (PerkinElmer).
T-cell Transwell migratory assay
For chemokine assays, 2×10∧6 T cells were seeded into the top insert of a 3.0 µm PET film with 400 ng/mL CCL3 added to the bottom wells. Migrating cells were observed using AO/PI staining and microscopy.
Phagocytosis assay
Mature bone marrow-derived macrophages were cultured and incubated with pHrodo Green E. coli bioparticle conjugates or pH-sensitive latex particles for 3 hours, followed by treatment with recombinant CCL3. Phagocytic ability was observed using inverted fluorescence microscopy.
T-cell killing assay
Isolated PBMCs and cultured macrophages were rested in RPMI 1640 with 10% FBS for 16 hours. Hepa1-6-luc cells were co-cultured in a 1:1:1 ratio with macrophages and PBMCs in the presence of CCL3 for 1 day, measuring T cell killing and tumor cell death via flow cytometry.
Tissue dissociation and single-cell suspension preparation
Mouse tumor tissue was stored in GEXSCOPE preservation solution at 2–8°C. Samples were washed with HBSS, chopped, and digested in GEXSCOPE dissociation solution at 37°C for 15 min. After digestion, cells were filtered, centrifuged, and resuspended in PBS to determine concentration and viability.
Immune cell sorting
The cell suspension was incubated with anti-mouse CD45 positive magnetic beads according to the manufacturer’s protocol. First, the cell suspension was mixed with CD45 positive magnetic beads and incubated for 30 min at 4°C with gentle agitation. After incubation, the cell suspension was placed in a magnetic field for sorting. CD45+ immune cells (magnetic cells) and CD45− non-immune cells (non-magnetic cells) were collected separately. The sorted cells were washed twice with PBS, and the CD45+ immune cells were resuspended in PBS to adjust the concentration for subsequent experiments.
scRNA-seq analysis
Raw reads were processed using CeleScope V.1.15.0 to generate gene expression profiles. Barcodes and UMIs were extracted, and R2 reads were aligned against the GRCm38 (mm10) transcriptome using STAR. Unique reads were assigned to genes with FeatureCounts, generating a gene expression matrix for further analysis.
Statistics and reproducibility
GraphPad Prism V.9.5.1 was used for statistical analysis. For two-group comparisons, two-tailed unpaired Student’s t-test or Wilcoxon test was used. For comparisons involving more than two groups, one-way or two-way analysis of variance was employed. The two-tailed log-rank test was used to compute p values for Kaplan-Meier survival curves. Data are presented as mean±SD. Normal distribution was assumed but not formally tested. Experiments were not randomized, and investigators were not blinded to allocation due to the exploratory nature of the study. No data were excluded from analyses, and only biological replicates were used. Statistical tests are indicated in each figure legend, with some diagrams created using Figdraw and the Home for Researchers editorial team (www.home-for-researchers.com).
Supplemental material
Data availability statement
Data are available in a public, open access repository. Data are available on reasonable request. All data relevant to the study are included in the article or uploaded as supplementary information. The raw sequence data from the bulk RNA-seq generated in this study have been deposited in the Gene Expression Omnibus (GEO) database under accession number GSE277065. The raw sequence data from the single-cell RNA-seq have been deposited in GEO under accession number GSE277066. Remaining data are available within the article, supplementary information, or source data file. Source data are provided with this paper.
Ethics statements
Patient consent for publication
Ethics approval
All animal experiments were approved by the Ethics Committee for Experimental Animal Welfare at Central South University (CSU-2023-0377).
References
Footnotes
Contributors All authors contributed significantly to the work presented in this manuscript. XM, WW, and ML conceptualized the study and supervised the manuscript. ML, LL, LC, WL, XG, MY, DW, YL, YD, JZ, CY, QL, HL and PR performed the methodology. ML, LL and LC analyzed the data. ML wrote the original draft. XM and WW supervised the manuscript. The corresponding authors for this manuscript are XM and WW. The guarantors of this study are XM and WW.
Funding This project was supported by grants from the National Natural Science Foundation of China (Grant No.82272102, 82372071), Key Project of the Science and Technology Program of Hunan Province (Grant No.2023ZJ1100).
Competing interests No, there are no competing interests.
Provenance and peer review Not commissioned; externally peer reviewed.
Supplemental material This content has been supplied by the author(s). It has not been vetted by BMJ Publishing Group Limited (BMJ) and may not have been peer-reviewed. Any opinions or recommendations discussed are solely those of the author(s) and are not endorsed by BMJ. BMJ disclaims all liability and responsibility arising from any reliance placed on the content. Where the content includes any translated material, BMJ does not warrant the accuracy and reliability of the translations (including but not limited to local regulations, clinical guidelines, terminology, drug names and drug dosages), and is not responsible for any error and/or omissions arising from translation and adaptation or otherwise.