Article Text

Abstract
Background Antiangiogenics combined with immune checkpoint blockade have become standard of care for recurrent endometrial cancer after standard platinum-based chemotherapy. To dissect mechanisms and define biomarkers associated with clinical outcomes to these combinations, we applied multidimensional immune monitoring to peripheral blood specimens collected from a randomized phase 2 trial of nivolumab with or without cabozantinib in 75 evaluable patients with recurrent endometrial cancer (NCI ETCTN 10104, NCT03367741). This trial demonstrated superiority of the combination to nivolumab alone.
Methods and results Using Olink proteomics, mass cytometry, tumor antigen-specific ELISA, and whole exome tumor sequencing, we identified longitudinal immune signatures specific to cabozantinib use, including an increase in plasma HO-1 and reduction in plasma vascular endothelial growth factor receptor 2, interleukin-12, and circulating plasmacytoid dendritic cells. Prior exposure to immunotherapy and carcinosarcoma histology had no adverse impact on clinical benefit or biomarkers, and copy-number high tumors were associated with increased plasma granzymes on combination treatment. Higher baseline plasma levels of myeloid-related markers (chemokine ligand 23/CCL23, colony-stimulating factor-1/macrophage colony-stimulating factor/CSF1) were associated with poor overall and progression-free survival, and lack of clinical benefit (defined as progressive or stable disease <6 months) following combination treatment (Kaplan-Meier, multivariate Cox, false discover rate <0.05). Patients with favorable outcomes had higher levels of activated T-cell markers (plasma ICOS-L, CD28) and exhibited spontaneous autoantibody titers to tumor antigen NY-ESO-1. Patients experiencing severe adverse events from the combination therapy had higher baseline levels of neutrophil-derived markers (CXCL1).
Conclusions Overall, this study highlights potential resistance and response mechanisms to nivolumab+cabozantinib and suggests prioritizing combination treatment in patients with activated T-cell immunogenicity profiles while exploring future combinatorial therapies targeting myeloid populations to overcome resistance.
- Immunotherapy
- Biomarker
- Next generation sequencing - NGS
- Antibody
- Immune Checkpoint Inhibitor
Data availability statement
Data are available upon reasonable request. In accordance with NIH’s Genomic Data Sharing Policy, the DNA sequencing data used to support the findings of this study will be deposited under controlled access in the database of Genotypes and Phenotypes (dbGaP) under accession number phs003414.v1. Genomic, clinical, mass cytometry, and protein analyte data from this study used to support this publication will be made available upon reasonable request from a qualified medical or scientific professional for the specific purpose laid out in that request and may include de-identified individual participant data. Requests for secondary use of this data will require completing a data use agreement (https://osp.od.nih.gov/wp-content/uploads/Model_DUC.pdf) and submitting a data access request to the NIH. All code used for analysis is available upon request at vladimir.roudko@gmail.edu (GitHub: https://github.com/VladimirRoudko).
This is an open access article distributed in accordance with the Creative Commons Attribution Non Commercial (CC BY-NC 4.0) license, which permits others to distribute, remix, adapt, build upon this work non-commercially, and license their derivative works on different terms, provided the original work is properly cited, appropriate credit is given, any changes made indicated, and the use is non-commercial. See http://creativecommons.org/licenses/by-nc/4.0/.
Statistics from Altmetric.com
WHAT IS ALREADY KNOWN ON THIS TOPIC
The combination of pembrolizumab and lenvatinib has been approved for patients with recurrent endometrial cancer post platinum-based chemotherapy. However, there is a lack of biomarkers to predict response or resistance to immunotherapy and antiangiogenic drugs in this setting.
WHAT THIS STUDY ADDS
Our study identifies novel blood-derived immune signatures of response and resistance to cabozantinib and nivolumab, compared with nivolumab alone in recurrent endometrial cancer. This study provides molecular bases for the clinical benefit of combination treatment in contrast to immunotherapy alone. In addition, this is the first study to assess biomarkers in the post immuno-oncological (IO) setting in endometrial cancer.
HOW THIS STUDY MIGHT AFFECT RESEARCH, PRACTICE OR POLICY
As programmed cell death protein 1 (PD-1) blockade together with chemotherapy was recently approved for first-line treatment of advanced endometrial cancer (EC), the therapeutic landscape of EC is evolving rapidly and moving towards personalized medicine. This study provides new data on immune mechanisms of response and resistance to IO and anti-angiogenic therapy that can drive new treatment strategies and prospectively identify biomarkers to assess in future post-IO trials.
Background
Endometrial cancer (EC) remains a significant clinical challenge as the most commonly diagnosed gynecologic malignancy in developed countries, with increasing incidence. Patients with advanced or recurrent EC present a poor prognosis, with a 5-year survival rate below 20%.1 The historical standard treatment for advanced EC is based on systemic chemotherapy, specifically carboplatin and paclitaxel.2 Recently, treatments combining traditional chemotherapy with drugs targeting programmed cell death protein 1 (PD-1) have led to new Food and Drug Administration approvals, including dorstalimab for mismatch repair-deficient (dMMR) tumors and pembrolizumab for dMMR and mismatch repair proficient EC in combination with carboplatin-paclitaxel as first-line therapies.3 4 However, treatment options remain limited for patients who experience progression or recurrence after platinum-containing therapies or following exposure to immuno-oncological (IO) agents, where no standard of care exists.
Targeting the endothelial cell microenvironment and angiogenic pathways together with IO agents has shown promise in improving treatment outcomes of EC at recurrence after platinum treatments. The inhibition of vascular endothelial growth factor receptors (VEGFRs) through the combination of lenvatinib with pembrolizumab has demonstrated clinical benefit (CB) in trials post platinum-based chemotherapy in immunotherapy naïve patients with EC.3 5 In the KEYNOTE-775 trial, lenvatinib, which targets VEGFR1, VEGFR2, and VEGFR3, showed a significant improvement in progression-free survival (PFS) and overall survival (OS) with a hazard ratio (HR) of 0.60 and 0.56, respectively.6 We also recently reported that cabozantinib (cabo), a tyrosine kinase inhibitor also targeting VEGFRs in addition to other pathways (MET, RET, and AXL), significantly improved PFS in recurrent EC post-platinum when combined with nivolumab (nivo) compared with nivo alone.7 This open-label randomized phase 2 clinical trial (NCI ETCTN 10104, NCT03367741, n=77 evaluable patients) also included an exploratory arm for patients with recurrent EC previously exposed to IO agents (hereafter referred to as prior IO) and patients with carcinosarcoma EC, where favorable outcomes were also observed. However, considering that patients treated with antiangiogenic+IO drugs eventually experience disease progression, it is crucial to establish molecular mechanisms of these agents and define biomarkers of treatment resistance.
The Cancer Genome Atlas (TCGA) has provided major insights into the molecular landscape of EC, identifying four distinct molecular subgroups: POLE-mutant, deficient DNA mismatch repair/microsatellite instability-high (dMMR/MSI-High), copy number low (CN-L), and copy number high (CN-H).8 9 These subgroups are associated with varying clinical outcomes and responses to therapy.9–12 For instance, patients with POLE-mutant and dMMR/MSI-High tumors generally respond well to immunotherapies, whereas those with CN-H tumors may require more aggressive treatment strategies.10 This molecular classification has paved the way for more personalized treatment approaches in EC, allowing for the selection of therapies tailored to the tumor’s genetic profile.
Despite the shift towards personalized medicine in EC, no biomarker of response has been identified in the recurrent post-platinum or post-IO setting for EC. Using longitudinal biospecimens from the randomized trial NCI ETCTN 10104 (NCT03367741), the present study is the first to report immune and molecular profiling associated with treatment outcome after nivo+cabo versus nivo alone. Using multidimensional assays and pipelines established within the CIMAC-CIDC network, we conducted extensive proteomic and cellular profiling of peripheral blood specimens, coupled with genomic analysis of tumor samples.11–13 These multiomic data sets were then analyzed in relation to study arm, prior IO status, carcinosarcoma status, and for associations with adverse events (AEs), PFS, and OS (OS, newly updated since the last report). By characterizing a set of soluble analytes, circulating immune compartments, and autoantibodies that are associated with treatment outcome and by identifying drug-specific effects on peripheral markers, we provide novel insights into mechanisms of treatment response, resistance, and toxicity. These findings aim to enhance patient selection and guide the development of future combinatorial treatment strategies, ultimately improving outcomes for patients with recurrent EC.
Materials and methods
Cohort, clinical trial, and sample characteristics
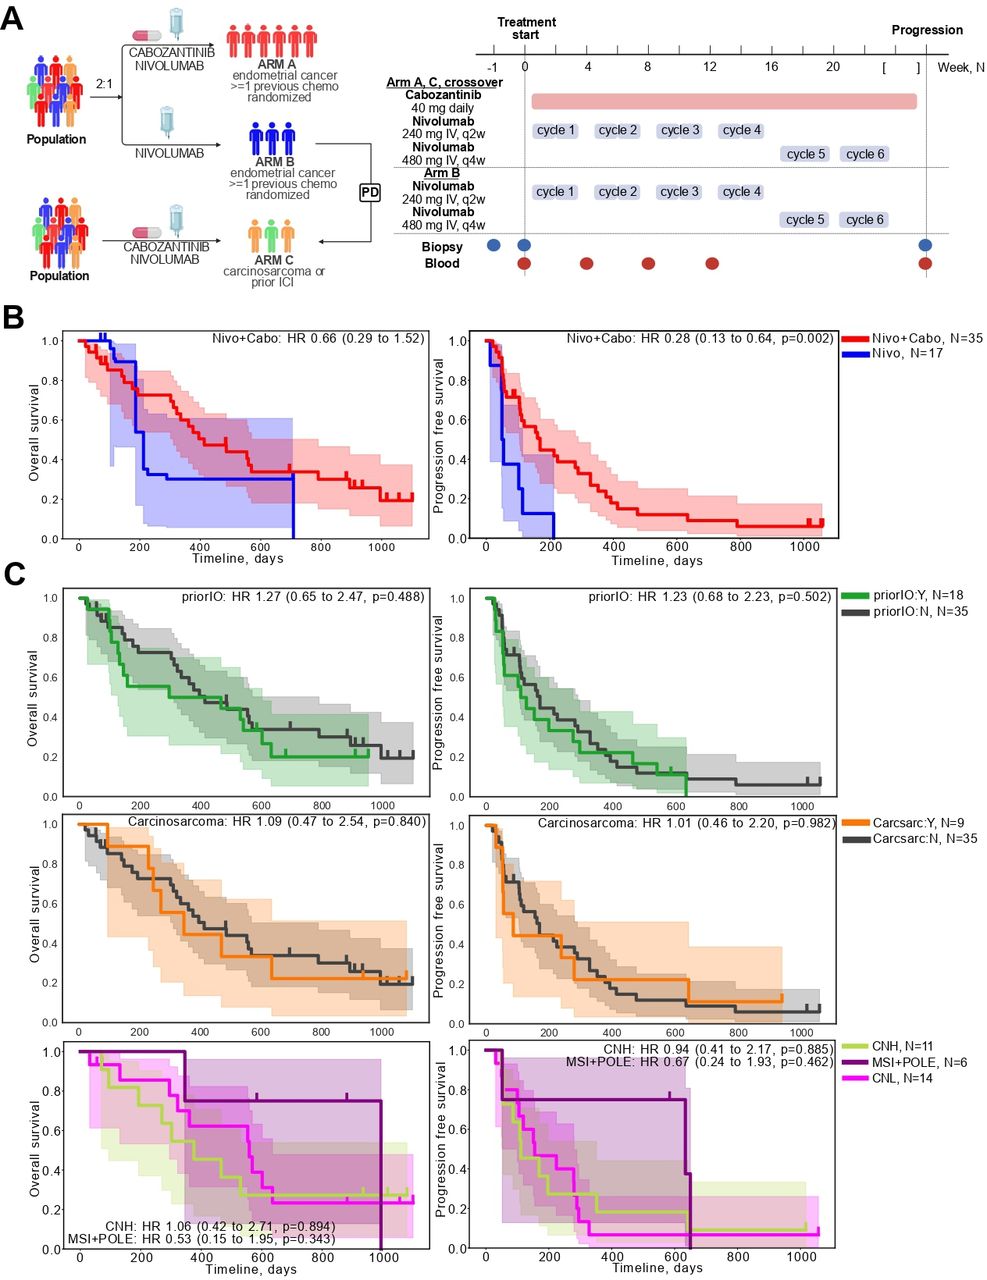
This open-label, randomized phase 2 trial (NCT03367741), previously reported by Lheureux et al, was conducted through the NCI’s ETCTN to assess the activity of nivo combined with cabo (Arm A) versus nivo alone (Arm B).7 Patients with advanced, recurrent, or metastatic (except for brain metastases) EC who did not receive previous immunotherapy were randomized 2:1 to Arms A and B. In Arm A, patients received intravenous nivo at 240 mg on days 1 and 15 of each 28-day cycle, combined with continuous daily oral cabo at 40 mg from days 1 to 28. Arm B patients received single-agent intravenous nivo at 240 mg on days 1 and 15 of each 28-day cycle. After completing four cycles, if tolerated, the nivo dose in all arms could be increased to 480 mg administered once every 28 days, at the discretion of the treating physician. Tumor responses were assessed every 8 weeks (±7 days) using CT scans, evaluated according to the Response Evaluation Criteria in Solid Tumors (RECIST) V.1.1. Patients who experienced disease progression in Arm B were allowed to cross over to combination therapy in exploratory Arm C, where they received the combination therapy identical to Arm A (nivo plus cabo at the same doses and schedule). This crossover aimed to provide patients who did not respond to nivo monotherapy with the potential benefit of combination therapy and required a mandatory new baseline biopsy at the time of cross-over. This exploratory Arm C also included patients with EC histology (up to 10 patients) and those previously treated with immuno-oncology (IO) therapies (up to 20 patients, including cross-over patients), namely anti-Programmed cell death protein (ligand) 1/PD
-(L)1, or anti-T-cell immunoglobulin and mucin-domain containing-3/TIM3, agents. The study schema, dosing regimen, route of administration, and drug schedule are detailed in figure 1A. For additional details regarding inclusion and exclusion criteria, dosing modifications, and study protocols, please refer to the extended online supplemental material methods section and the previously published primary manuscript.
Supplemental material

(A) Trial schema (left) and treatment timeline with biospecimen collection time points for biomarker profiling (right). (B) Overall survival (OS) and progression-free survival (PFS) for randomized treatment arms: single agent nivolumab (Arm B, blue) and combination treatment nivolumab+cabozantinib (Arm A, red). Inverse probability of censoring weighting weights are applied to adjust for crossover for OS. (C) OS and PFS within nivo+cabo combination-treated arms only stratified by prior immunotherapy status before combination. In green are patients treated with IO prior to receiving combination treatment (cross over Arm B subject (n=8) and the prior-IO subset from Arm C (n=10). In gray are patients with no previous IO exposure (Arm A, n=35) (D) OS and PFS outcomes stratified by histological type of the primary tumor, either carcinosarcoma (in orange, n=9) or not (gray, n=35). Subjects include Arm A and the carcinosarcoma subset of Arm C; (E). OS and PFS outcomes stratified by primary tumor classification based on somatic mutation profiles and projected on The Cancer Genome Atlas endometrial cancer classes. This analysis includes all trial subjects for whom whole exome sequencing data was available. CN-H, copy number high; CN-L, copy number low; ICI, immune checkpoint inhibitor; IO, immuno-oncological; MSI, microsatellite instability; OS, overall survival; PFS, progression-free survival.
Blood samples including plasma and peripheral blood mononuclear cells were collected prior to cycle 1 (baseline), cycle 2, cycle 4, and at progression, while tumor tissues were archival and/or collected as baseline biopsies. This manuscript reports on the biomarker cohort, which includes all patients with available biospecimen data (n=75). A total of 36 patients in Arm A, 17 in Arm B, and 22 in Arm C (11 prior IO, 10 carcinosarcoma, 1 both) were included in this analysis. One patient in Arm B did not have available biospecimens for biomarker analysis at any time point. The primary endpoint was PFS, defined as the interval between randomization and either disease progression or death from any cause, whichever occurred first. Secondary endpoints included the overall response rate as defined by RECIST (V.1.1), OS, and safety assessed according to the Common Terminology Criteria for Adverse Events V.5.0. Biomarker analyses were considered exploratory.
Biomarker assays
Olink
Peripheral blood plasma samples were analyzed using Olink’s Proximity Extension Assay technology with the Immuno-Oncology panel, which enables the simultaneous quantification of 92 proteins—including cytokines, chemokines, and IO markers—across 96 samples. The assay was conducted according to the manufacturer’s instructions, incorporating both internal and external reference controls to ensure data quality. The resulting data were normalized to NPX (normalized protein expression) values on a log2 scale (RRID:SCR_003899).
Grand Serology
An ELISA was employed to detect and quantify circulating IgG antibodies against known tumor antigens, following established protocols.14 15 Plasma samples were analyzed using a low-volume, semi-automated ELISA to assess seroreactivity against a panel of recombinant protein antigens, including NY-ESO-1, TP53/p53, SOX2, HORMAD1, ERG, DHFR, PRAME, WT1, MELAN-A, SURVIVIN, UBTD2, CT47, MAGE-A4, SSX4, CT10, SSX2, XAGE, GAGE7, and MAGE-A10. Low-volume 96-well plates were coated overnight at 4°C with 0.5 µg/mL of each antigen. Following coating, plates were blocked for 2 hours at room temperature with phosphate-buffered saline (PBS) containing 5% non-fat milk and 0.1% Tween 20. Plasma samples were serially diluted from 1:100 to 1:6,400 in fourfold increments and added to the blocked and washed plates. Each plate included positive and negative controls, consisting of pooled sera from healthy donors, to validate the assay and facilitate titer calculations. After overnight incubation, plates were thoroughly washed with PBS containing 0.2% Tween 20 and rinsed with PBS. Antigen-specific IgG was detected by incubating with alkaline phosphatase-conjugated goat anti-human IgG (SouthernBiotech 2040–04, diluted 1:4,500). Detection was performed using AttoPhos substrate and buffer, and fluorescence was measured with a BioTek Synergy reader. Reciprocal titers for each sample and antigen were calculated via linear regression, determining the dilution at which the titration curve intersected a predefined cut-off value.14 A result was considered positive if the reciprocal titer exceeded 100 (RRID:SCR_019873). A positive significant result was defined as reciprocal titers >100, i.e., >2 after log10 transformation (RRID:SCR_019873).
Cytometry by time-of-flight
Mass cytometry analysis was conducted on peripheral blood mononuclear cells (PBMCs) following a standardized protocol.15 16 Briefly, 1–5 × 10⁶ thawed PBMCs were labeled using palladium-based mass tags for barcoding. Subsequently, cells were stained with a panel of metal-conjugated antibodies targeting major immune subsets and surface activation markers. Bead controls were included to facilitate data normalization. Flow cytometry standard files underwent bead-based normalization, followed by exclusion of Ce140+beads and bead-cell doublets, Gaussian ion cloud multiple fusion events, and Rh103+dead cells. Major immune cell subsets were identified using a hierarchical clustering approach (Astrolabe Diagnostics) and further confirmed through manual gating. The resulting data included cell counts, frequencies, and marker expression quantiles.
Whole exome sequencing
DNA was isolated from fresh blood samples and formalin-fixed paraffin-embedded archival and biopsy blocks. Next-generation sequencing (NGS) libraries were prepared using the TWIST NGS target enrichment kit, following the MD Anderson-CIMAC harmonized protocol. The prepared libraries underwent quality control assessments using the D1000 system to estimate the DNA integrity number and the A260/280 ratio. Subsequently, sequencing was performed on an Illumina platform with 100-base pair paired-end reads.
Statistical and data analyses
Quality controls
The analysis for all data sets (Olink, serology, cytometry by time-of-flight (CyTOF), whole exome sequencing (WES)) was performed in Python and Python implementations of R statistical software. The data distributions for markers and cell populations for all assays were investigated as part of a routine quality control to identify biases and corrected as follows: Olink analytes with zero variance were excluded; Olink analytes with abundances below the limit of detection in more than >50% of samples were excluded; CyTOF cell populations unassigned by Astrolabe were ignored. Quality control was performed using principal component analysis and principal variance component analysis using scanpy (online supplemental table 1, online supplemental figures 3 and 6).
Supplemental material
Supplemental material
Supplemental material
Longitudinal data analysis
Longitudinal protein expression analysis was performed in Python using packages Pymer (lme4 R implementation in Python). The linear mixed-effects model (LMEM) included treatment arm, time, and its interaction as fixed effects as well as other relevant covariates needed for adjustment. Specific covariate details can be found in the figure legends. The model also included a random intercept for each patient and a compound symmetry correlation structure was assumed. Models were fitted using restricted maximum likelihood method (REML), and the Emmeans package was used to extract marginal mean estimates and test the hypothesis of interest, namely differences over time within treatment arms, tumor EC histology, prior IO status, tumor genomics or AE status, as well as differences across the groups defined for those factors. Marginal mean and 95% CIs were estimated using emmeans and visualized using the forestplot package. For Olink, the response variables were individual protein levels (normalized expression units/NPX, log2). For CyTOF, the response variables were cell frequencies, the surface markers mean fluorescence intensity values or subset frequencies defined automatically by Astrolabe. The results were visualized using seaborn and matplotlib packages (online supplemental table 1).
Whole exome sequencing analysis
We used the WES somatic mutation calling pipeline nf-core/sarek implemented in the nextflow pipeline management system (17). Identified somatic mutations by Mutect2 and Strelka2 were annotated using VEP and filtered for known tumor drivers in TP53 and POLE genes. For patients with matched tumor/normal samples, we performed formal copy-number analysis using combined outcomes from ASCAT, ControlFreq, CNVkit, and mutation signature quantification by projecting SBS/INDEL signatures on the COSMIC database. MSI calling was done with MSIsensor2 implemented within the nf-core/sarek pipeline.17
Survival analysis for the secondary randomized controlled trial (RCT) endpoint
As OS was not presented in the parent trial manuscript, we are including a complete analysis for this important endpoint before assessing the biomarkers defining the treatment response. We included the Kaplan-Meier (KM) modeling censored at the time of crossover, as presented in the clinical trial protocol, but included sensitivity analysis using both phases of the trial study. The analysis population includes all patients with available biomarker data (Arm A: n=35, Arm B: n=17). Please see extended online supplemental material methods for complete details.
Association of biomarkers with OS survival and time-to-AE
Univariable and multivariable regression models were used to estimate the HRs and corresponding 95% CIs for time-to-event outcomes. The log-rank test was used to assess the significance of the difference between endpoints for OS, PFS, and time to first AE in KM analysis. Relevant clinical variables that were significant in univariate models were used as covariates in further multivariable models. Regression models were fit, survival analyses performed, and visualizations were created in a Python environment using lifelines, Matplotlib, Seaborn and Pandas packages (online supplemental table 1). The constructed pipeline is available as a Jupyter Notebook on request. Significance was defined as adjusted p values or false discovery rate (FDR)<0.05.
Adjusting for multiple comparisons
In multiomic assays (Olink and CyTOF) LMEM were fitted using the limma framework for high-throughput data, which use a Bayesian estimation method where differences are tested using moderate t-test statistics, resulting in increased power. We adjusted p values using the Benjamini and Hochberg method, controlling the false discovery rate, the expected proportion of false discoveries among the rejected hypotheses.18 Nevertheless, considering the sample size limitations, throughout the manuscript we show nominally significant results as p≤0.05 and results significant after adjustment for multiple testing as FDR≤0.05.
Results
Trial design and updated survival outcomes
From 82 patients enrolled in study NCT03367741, 77 were treated and 75 were evaluable for immune biomarker analysis: 36 in Arm A (nivo+cabo), 17 in Arm B (nivo) and 22 in Arm C (nivo+cabo, 11 after prior IO, 10 carcinosarcoma, 1 both), with blood collected at baseline and prior to cycle 2, cycle 4, and at progression (figure 1A). Patient characteristics were similar to those of the parent cohort (table 1), except for two patients who were not included in this analysis due to lack of follow-up data and/or missing biomarker data. OS analyses, which had not been previously reported, included 24 events in Arm A and 8 events in Arm B. Considering that cross-over could potentially bias estimates of OS, we applied an inverse probability of censoring weighting (IPCW) model to account for departure from randomization of clinical variables on cross-over. The median OS was estimated to be 13.6 (95% CI: 10.2 to 25) months for Arm A and 7.4 (95% CI: 3.7 to 23.3) months for Arm B. The HR, as calculated using IPCW, was 0.66 (95% CI: 0.29 to 1.52), and did not reach significance by the log-rank test (figure 1B). The censored overall survival analysis showed an HR of 0.71 (95% CI: 0.31 to 1.63) for the combination arm compared with monotherapy (online supplemental figure 1).
Supplemental material
Cohort characteristics
We also analyzed patients included in exploratory Arm C for associations between survival outcomes and prior IO treatment, carcinosarcoma status, or tumor genomic type, among patients treated with nivo+cabo only (figure 1C). Somatic mutation calling was performed for patients with available tumor genomic DNA (n=51, online supplemental figure 2) and genomic tumor subgroups were assigned based on established TCGA classifications.9 Patients treated with prior IO (consisting of Arm C subset and Arm B patients after crossover) or patients with carcinosarcoma histology had similar OS or PFS when compared with IO-naïve or non-carcinosarcoma histology (consisting of Arm A patients) (figure 1C). In patients previously exposed to IO, median OS was estimated to be 9.70 (95% CI: 3.15 to 19.80) months. For the carcinosarcoma group, median OS was 11.3 (95% CI: 3.0 to inf) months. At the genomic level, none of the three subgroups—CN-H, CN-L, or hypermutated (MSI and POLE mutations)—showed significant differences from each other in OS or PFS metrics. However, a trend toward better survival was observed in the hypermutated group, consistent with previously reported benefits of immunotherapy alone in this population.7 18
Supplemental material
Treatment-induced changes in plasma proteomic biomarkers
To identify the effects of treatment on plasma analyte levels, we modeled the longitudinal changes in analyte concentration (NPX, log2 values) using an LMEM, adjusting for time period (ie, before and after crossover) and accounting for within patient correlation structure. While there were no significant baseline differences, we detected three distinct treatment-related longitudinal patterns (figure 2A, online supplemental figure 2): analytes significantly (FDR≤0.05) upregulated in response to nivo+cabo combination treatment (including HO-1, FASLG) but not to single-agent nivo treatment; analytes significantly upregulated in response to immunotherapy regardless of cabo treatment (including PDCD1/PD-1, CXCL10); and analytes significantly downregulated exclusively in response to combination treatment (including interleukin (IL)-12, VEGFR2), highlighting a reduction in soluble VEGFR2 likely attributed to cabo.

(A) Soluble plasma IO proteins (Olink) associated with treatments. Heatmap illustrating the temporal expression of soluble plasma proteins in patients randomized to Arm A or Arm B. Values represent Z-scores of the estimated marginal means (EMMs) derived from linear mixed-effects model for the interaction of treatment and time point, accounting for crossover (time period), tumor genotype and random patient-level effects. C1, C2, C3, P are blood collection time points at C1D1, C2D2, C4D1 and progression, respectively. Time points are grouped per treatment arms: Arm B nivo (blue) or Arm A nivo+cabo (red). Boxplots highlight selected biomarkers upregulated by nivo+cabo combination treatment (red frame: HO-1, FASLG), immunotherapy in general (green frame: PDCD1, CXCL10), or downregulated by nivo+cabo combination (blue frame: IL-12, VEGFR2). Trend lines represent adjusted marginal means per time point per arm with estimated 95% CIs. Statistical significance was inferred from post hoc marginal mean difference analysis for all possible pairwise comparisons: between time points per treatment or between treatments per time point. (B) Exploratory biomarkers associated with prior immunotherapy (prior IO) status in nivo+cabo treated patients from Arm A, Arm B after crossover, and Arm C. Values are z-scores of EMM of NPX for prior-IO status and time point interaction, controlling for genomics, histology, (carcinosarcoma yes or no) and patient-level random effect. Heatmap of selected biomarkers elevated at C1D1 in patients being exposed to prior IO. Time points are grouped per prior IO status: IO-naive (N, gray) or pretreated (Y, green). The middle boxplot shows temporal dynamics of PD-1 soluble levels. The bottom scatterplot shows the regression of PD-1 soluble levels (NPX values, log2) as a function of time to previous anti-PD-1 treatment in days. (C.) Association of tumor genomics subtypes, copy number high (CN-H) and copy number low (CN-L), with longitudinal profiles of soluble analytes in nivo+cabo treated patients from Arm A, Arm B after crossover, and Arm C. From this model, EMM of NPX for genomics and time point are computed, controlling prior-IO, carcinosarcoma, and patient-level variability. Left—boxplots showing GZMB and TNFRSF4/OX40 levels in CN-H versus CN-L during combination treatment. Right—clustermap showing signature of soluble analytes associated with differential patterns in CN-H versus CN-L. IL, interleukin; IO, immuno-oncology; NPX, normalized protein expression; PD-1, programmed cell death protein 1; VEGFR, vascular endothelial growth factor receptor.
Next, we asked whether proteomic soluble analytes in the nivo+cabo combination-treated patients were affected by prior IO use, carcinosarcoma histology, or tumor genomic subtype. In immunotherapy-naïve patients, we observed a significant upregulation from baseline in plasma levels of PDCD1, CXCL9, CXCL10, and CRTAM (figure 2B, online supplemental figure 4). This upregulation was attributed to the on-target activity of nivo (targeting PDCD1/PD-1) and to the activation and mobilization of T cells associated with CXCL9, CXCL10, and CRTAM (figure 2B). In contrast, patients who had previously received IO therapies exhibited already elevated baseline levels of these markers and did not show further increases after combination treatment. This observation suggests that the elevated baseline levels of soluble PDCD1 in prior IO-treated patients may reflect a drug-driven, time-dependent effect, where recent IO therapy leads to increased detection of PDCD1 in the blood. Correlating PDCD1 baseline levels with the number of days between prior IO and first nivo+cabo treatment confirmed a strong negative linear relationship (Pearson correlation coefficient R=−0.7, p=0.01, figure 2B). Proteomic biomarkers of cabo treatment (such as IL-12, HO-1, VEGFR2) were independent of carcinosarcoma histology status (online supplemental figure 4). We then explored the impact of tumor genotype on the longitudinal dynamics of plasma analytes in combination-treated patients. We identified a cytotoxicity module (GZMB, GZMH) upregulated in plasma post-combination treatment in CN-H compared with CN-L cancer types, suggesting potential higher T-cell activation in this subtype (figure 2C, online supplemental figure 5). Additionally, ANGPT2, TNFRSF4/OX40, and MUC16/CA125 were elevated from baseline and throughout treatment in CN-H compared with CN-L (figure 2C, online supplemental figure 5), suggesting tumor-derived differences including angiogenic, immune checkpoint, and antigenic pathways from the tumor microenvironment driven by genomics. As a result, genomic status was included as a covariable in the mixed-effect models used for all heatmaps and boxplots in figure 2.
Supplemental material
Supplemental material
Treatment-induced changes in peripheral blood mononuclear cell
Next, we asked whether immune subset frequencies in PBMC and surface marker levels on T and myeloid populations varied in their cellular dynamics based on treatment, prior IO, carcinosarcoma status, or tumor genomics. Applying a similar LMEM approach to simultaneously model changes in each cell type frequency or changes in mean surface expression levels of activating/inhibitory markers longitudinally after adjustments described for Olink, we detected significant differences (FDR≤0.05) in memory B cell and plasmacytoid dendritic cell (pDC) compartments depending on treatment (figure 3A, online supplemental figures 3 and 4B). An increase in B-cell memory levels was observed at cycle 4 of nivo+cabo treatment, but not with nivo alone. Conversely, a continuous reduction from baseline was noted for pDC levels only in the nivo+cabo arm (FDR≤0.01). This cabo-specific impact on pDC reduction was most pronounced within combo-treated prior IO naïve patients with EC and not observed in patients with carcinosarcoma. The B-cell spike was associated with endometrioid cancers only (figure 3B) and with the CN-L tumor subtype (figure 3C, online supplemental figure 5). When considering activating/inhibitory biomarker levels on profiled immune subsets, no significant differences were observed between arms or time for the majority of markers, except a strong nivo-related downregulation of PD-1 levels on memory T cells. PD-1 surface expression levels were significantly associated with prior IO status: protein surface levels on T-cell memory subsets appeared downregulated at baseline if patients received treatment with PD-1 agents before starting the nivo+cabo combination (figure 3D). Similarly to the elevation of plasma PDCD1/PD-1 levels partially attributed to nivo drug interaction, PD-1 detection by mass cytometry is also known to be affected by nivo because the detection epitope of membrane PD-1 becomes masked by in vivo saturation of that target with the therapeutic antibody.19 We correlated PD-1 intensity levels on T-cell subsets with the time interval between prior IO and cycle 1 of combination treatment (in days) and observed a strong positive linear relationship within T-cell memory compartments only but not naive T cells, in accordance with expected PD-1 expression on these cell subsets (figure 3D). Despite this strong correlation, prior IO status did not impact survival, as previously described in figure 1C.

(A) Treatment-induced changes in cellular PBMC immune subsets (cytometry by time-of-flight) in patients from randomized Arms A and B. From this model, estimated marginal mean of population frequency for each treatment arm and time point are computed, controlling for crossover effects (time period), genomics, microsatellite instability status, and patient-level variability. Boxplots highlight cell populations with any significant change following nivo+cabo combination treatment (B memory cell subset and plasmacytoid dendritic cell). Trend lines represent adjusted marginal means per time point per arm with estimated 95% CIs. Statistical significance inferred from post hoc marginal mean difference analysis of all possible pairwise comparisons: between time points per treatment or between treatments per time point. (B) Association of B memory cell and plasmacytoid dendritic cell subset PBMC frequency in nivo+cabo patients only, either pretreated with immunotherapy or crossed over from arm B (left) or with carcinosarcoma tumor type (right). Linear mixed-effects model applied is for the prior-IO and time point interaction, controlling for genomics, carcinosarcoma, and patient-level variability as well as carcinosarcoma and time point interaction, controlling for genomics, prior-IO, and patient-level variability to explore carcinosarcoma associations. (C) Left—PD-1 expression estimated by mean surface expression values on T-cell subsets in patients pretreated with immunotherapy. Right—scatterplot showing correlation between PD-1 mean expression intensity and time to prior anti-PD-1 treatment in days. (D) Boxplot showing the impact of tumor genomic groups on longitudinal B memory cell frequency in patients treated with nivo+cabo. IO, immuno-oncology; MFI, mean fluorescence intensity; PBMC, peripheral blood mononuclear cell; PD-1, programmed cell death protein 1.
Associations of early blood biomarkers with clinical outcomes
After assessing immune changes associated with treatment, the immune correlative plan aimed to identify proteomic, cellular, or humoral biomarkers measured at baseline and early on treatment (cycle 2, day 1). These features were used to distinguish differential patient outcomes to treatment including OS, PFS, CB (defined as a best radiographic response of complete response (CR), partial response (PR), or stable disease (SD)>6 months versus lack of clinical benefit (NCB, defined as progressive disease or stable disease of less than 6 months, PD or SD<6 mo), and severe AEs (defined as serious or as grade 3 or higher, and at least possibly attributed to treatment). No circulating immune subsets from CyTOF analyses at baseline had predictive value for any of these outcomes. In contrast, several plasma analytes were consistently associated with worse OS/PFS and NCB in patients treated with nivo+cabo: elevated baseline levels (higher than median) of CCL23 (chemokine ligand 23, also known as macrophage inflammatory protein 3/MIP-3) and CSF1/M-CSF (colony stimulating factor 1 also known as macrophage colony stimulating factor) were associated with significantly worse OS and PFS in KM univariate analyses (p≤0.05), Cox multivariate analyses (p≤0.05), as well as with NCB in longitudinal mixed effect regression model. Interestingly, we detected two soluble analytes predictive of better outcomes to combo treatment at cycle 2, day 1, namely TRAIL and CX3CL1/Fractalkine. While TRAIL is a known marker of apoptosis, fractalkine (a ligand for CXCR3 known to be enriched on Th1 cells) might reflect ongoing immune mobilization on treatment initiation in IO naïve patients (figure 4A–C, online supplemental figure 7). Besides a cytokine signature of myeloid cell engagers (CCL23, CSF1, CCL20), multivariate Cox regression analysis in patients treated with nivo+cabo also identified other proteomic biomarkers associated with elevated hazard, known to be enriched in cancer subjects with poor prognosis (ANGPT2, IL-10, PD-L1).13 20 Longitudinal changes revealed immune-presentation pathways (CD40, OX40) and tumor-derived markers (MUC16, HGF) associated with resistance to combo treatment (figure 4C). Components of the Th2 response (IL-4, IL-13), general T-cell activation and apoptosis-inducing markers (CD28, ICOSLG, FASLG, TRAIL) were elevated in subjects with longer OS, PFS or experiencing CB, mainly elevated longitudinally on combo treatment (figure 4B–C). Interestingly, a proteomic signature of neutrophil mobilization factors (CXCL1, CXCL5) was associated from baseline with subjects experiencing ≥3 grade or serious AEs (pos, figure 4D). Together, these results identify soluble tumor-derived, pre-existing myeloid and activated T-cell signatures of mechanisms potentially mediating resistance and response to nivo+cabo, respectively.
Supplemental material

Soluble analytes (Olink) and antibody profiling (Grand Serology) associations with clinical outcomes. (A) Baseline levels of CCL23 (left) and CSF1 (right) are predictive of better overall (top row) and progression-free (bottom row) survival in combination treatment. Kaplan-Meier univariate survival regression per treatment arm based on high (above median) and low (below median) cytokine levels balancing for crossover by IPCW method (infered subject weights are listed in the online supplemental table 2). (B) Cox multivariate regression analysis assessing the association of baseline cytokine levels with survival in combination treatment. Elevated levels of CSF1 and CCL23 (highlighted in red), among others, are significantly associated with increased HRs. (C) Heatmap of soluble analyte signatures associated with clinical benefit (CR+PR+SD (>6 months)) or progression (PD+SD (<6 months)) in nivo+cabo treatment arm only derived from LMEM of clinical benefit and time point, controlling for genomics, carcinosarcoma, prior IO, and patient-level variability, where prior IO includes crossover subjects from Arm B and IO-pretreated from Arm C. (D) Elevated expression of neutrophil mobilization signature (heatmap, top) and cytokines (CXCL5, boxplot) are associated with manifestation of serious or grade ≥3 adverse events. C1, C2, C3, and P are blood collection time points at C1D1, C2D2, C4D1, and progression, respectively. Time points are grouped by toxicity: AE-negative (blue) or AE-positive (red). Trend lines on the boxplot represent adjusted marginal means per time point per arm with estimated 95% CIs derived from the LMEM model of the adverse event and time point interaction term, controlling for genomics, carcinosarcoma, prior IO, and patient-level variability as a random effect. Statistical significance inferred from post hoc marginal mean difference analysis of all possible pairwise comparisons: between time points per strata or between strata per time point. (E) Baseline plasma antibody titers against tumor-associated antigen NY-ESO-1 were associated with better overall survival in Kaplan-Meier (top) and Cox (bottom) regression analyses. Kaplan-Meier univariate survival regression was done per treatment arm using high (antibody titer above 2, log10) and low (antibody titer below 2, log10) antibody titers balancing for crossover by IPCW method. AE, adverse event; CCL23, chemokine ligand 23; CR, complete response; CSF1, colony stimulating factor 1; IO, immuno-oncological; IPCW, inverse probability of censoring weighting; LMEM, linear mixed-effects model; NPX, normalized protein expression; OS, overall survival; PD, progressive disease; PFS, progression-free survival; PR, partial response; SD, stable disease.
Supplemental material
Based on the hypothesis that pre-existing tumor-specific T cells may confer CB, we asked whether some tumors were spontaneously more immunogenic than others by testing for autoantibodies to a panel of known tumor antigens. We profiled longitudinal plasma samples to 20 cancer-testis, differentiation, or mutational tumor-associated proteins by ELISA and found prevalence of NY-ESO-1-specific as well as p53-specific plasma IgG titers from baseline in a subset of patients (online supplemental figure 8). When testing whether baseline titers were associated with clinical outcomes, high NY-ESO-1-specific antibody levels were associated with better outcomes (OS, PFS in both univariate KM and multivariate Cox regression) in patients receiving nivo+cabo combination HR=0.57 95% CI: (0.35 to 0.91, p=0.019) (figure 4E, online supplemental figure 8A). In patients receiving single-agent nivolumab, elevated NY-ESO-1 antibody titers were also associated with longer OS. However, this finding did not remain significant after correcting for multiple hypothesis testing. In contrast, p53 antibodies were more prevalent in patients with poor CB (PD+SD<6 months) and were highly correlated with CN-H genotype, in accordance with the presence of p53 somatic mutations in this group (online supplemental figure 8B).
Supplemental material
Discussion
This study aimed to define biomarkers associated with clinical outcomes of cabo and nivo in recurrent EC compared with nivo alone and to characterize the impact of prior immunotherapy, EC tumor histology, or genomics. We report updated clinical outcomes to clinical trial NCT03367741 and, for the first time, the longitudinal assessment of immune-related proteomic, cellular, and antibody blood biomarkers.
Treatment with anti-PD-1 agents was associated with on-target stabilization of plasma PDCD1/PD-1 (nivolumab target), with elevated levels nearly perfectly anticorrelated with time from last anti-PD-1 administration. Conversely, PD-1 detection was abolished post-nivo on effector and memory peripheral T cells, due to epitope masking by the immunotherapy drug.19 Another on-target observation was decreased plasma VEGFR2 (cabo target) in combo-treated patients, consistent with downregulation of this protein by the antiangiogenic drug as reported in patients with cholangiocarcinoma, prostate, and sarcoma treated with cabo.21–23 A persistent CXCL9 and CXCL10 T-cell mobilization signature occurred in plasma in response to nivo, regardless of cabo, implying sustained T-cell homing to tissue sites by the immunotherapy in EC. This confirms similar observations in multiple other tumor types where increased levels of circulating CXCR3 ligands were seen on checkpoint blockade in IO-naive patients, regardless of outcome.13 15 24 Accordingly, high plasma levels of CXCL9 and CXCL10 were found at the time of crossover and at baseline in prior IO-treated patients, and they remained elevated without further upregulation on additional therapy. Importantly, cabo treatment induced a unique, previously unreported biomarker pattern, including upregulation of plasma HO-1 and hypoxia/ischemia markers (ADGRG1, ADA, CAIX), as well as downregulation of peripheral plasmacytoid DC and of plasma IL-12, a cytokine almost exclusively produced by maturing professional antigen-presenting cells. We hypothesize that HO-1 is induced in response to vascular injury from cabo, consistent with HO-1’s reported anti-inflammatory role promoting tissue repair.25 Similarly, pDCs, which could be a source of IL-12 on maturation, are known to contribute to inflammation in tumors and may be indirectly reduced by repeated cabo treatment, though a direct effect cannot be excluded based on reported VEGFR2 regulation of pDC function.26 Importantly, described proteomic longitudinal trends were independent of tumor type: patients with endometrioid/serous and carcinosarcoma EC showed similar treatment-induced changes with combo treatment (figure 2, online supplemental figure 3).
Using molecular profiling to elucidate clinical response to treatment, monocyte/macrophage mobilizers CCL23 and CSF1/M-CSF in plasma were uniformly associated with poor clinical outcomes to nivo+cabo from baseline, whether considering OS, PFS, or PD+SD<6 months. Both cytokines co-clustered with a larger proteomic signature associated with progression and reduced survival, including antigen-presenting cell-derived costimulatory molecules CD40 and OX40 (possibly as decoy shed receptors), immunosuppressive cytokine IL-10, as well as ANGPT2, an angiogenic factor previously described as a predictor of poor survival to nivolumab in melanoma.27 Together, these findings suggest a myeloid signature of treatment resistance counteracting nivo+cabo efficacy through macrophage mobilization and reduction of effector T-cell engagement. Accordingly, a signature of activated T cells (ICOSLG, FASLG, CD28) and Th2 polarization markers (IL-4, IL-13) detected in baseline plasma, accompanied by tumor-antigen specific antibodies against NY-ESO-1, was consistently associated with improved CB (OS, PFS, CR+PR+SD>6 months). In addition, higher CX3CL1 plasma levels in IO-naïve patients when measured prior to cycle 2 were associated with better outcomes to combo treatment, suggesting pharmacodynamic activation of not only Th2 but potential Th1-related pathways in responders as well. Circulating NY-ESO-1 antibodies have been shown to correlate with the presence of NY-ESO-1-specific T cells, hinting at tumor-specific integrated immunity contributing to better outcomes.28 29 This data supports the notion that pre-existing tumor-specific effector T and B cells were critical for prolonged benefit to cabo+nivo, while elevated myeloid populations may mediate immune suppression and resistance to this treatment. Among patients experiencing ≥3 grade or serious AEs, neutrophil markers CXCL1 and CXCL5 were elevated from baseline, suggesting toxicity of antiangiogenics added to immunotherapy may be mitigated by neutrophil-reducing strategies. Hypotheses generated from these circulating markers will need to be tested for their potential impact at the tumor site by profiling the immune tumor microenvironment cells through proteomic and transcriptomic analyses (ongoing work).
This study had a unique robust analytical design using LMEM, KM and Cox regressions to define biomarkers of treatment, response, or toxicity while adjusting for multiple variables, including tissue histology, prior treatments, longitudinal changes, and tumor genomic subtype. As tumor genomic makeup may impact blood biomarkers in response to combo treatment, we leveraged somatic mutation calling from whole exome sequencing to classify tumors on CN-H/CN-L or hypermutated subtypes defined by TCGA endometrial classification.9 This revealed an unexpected T-cell cytotoxicity signature (GZMB, GZMH) significantly upregulated in response to combo treatment in CN-H compared with CN-L tumors (figure 2C). Given potential improved outcomes reported in CN-H EC subjects treated with IO and platinum-based chemo regimens, we speculate this granzyme association might be related to tumor cell genotoxic stress induced by somatic TP53 mutations/CN-H and promoting T-cell activation through STING-cGAS/TLR9 stimulation.30 31 This exploratory analysis is hypothesis-generating, which requires further validation.
Limitations of the current study include the absence of a cabo-alone arm to parse out the synergistic effects of the combination therapy versus single agent. However, another study assessed the activity of cabo alone demonstrating its modest benefit and suggesting that combining it with immunotherapy, as observed with the pembrolizumab and lenvatinib combination, could provide greater advantages.7 32
In conclusion, this comprehensive blood immune monitoring study sheds light on the mechanism of action of combining a multi-kinase inhibitor (cabo) that targets angiogenesis with an immune checkpoint inhibitor (nivo). It provides pilot data on biomarkers associated with patient outcomes, which can inform future treatment strategies. Our findings suggest new approaches to overcoming resistance mediated by myeloid cells. These include using macrophage-targeting drugs, selecting patients with a higher likelihood of response based on tumor antigen-specific T-cell activation and low myeloid signatures, and mitigating toxicity through control of neutrophil activity. Possible future treatments implied by our findings may involve targeting resistance-mediating myeloid cells, including but not limited to CAR-T therapies and monoclonal or bispecific antibodies; or supplementing a poorly immunogenic T-cell environment with neoantigen vaccines. Future clinical studies will require biomarker assessments to tailor treatment courses and better serve patients’ needs.
Data availability statement
Data are available upon reasonable request. In accordance with NIH’s Genomic Data Sharing Policy, the DNA sequencing data used to support the findings of this study will be deposited under controlled access in the database of Genotypes and Phenotypes (dbGaP) under accession number phs003414.v1. Genomic, clinical, mass cytometry, and protein analyte data from this study used to support this publication will be made available upon reasonable request from a qualified medical or scientific professional for the specific purpose laid out in that request and may include de-identified individual participant data. Requests for secondary use of this data will require completing a data use agreement (https://osp.od.nih.gov/wp-content/uploads/Model_DUC.pdf) and submitting a data access request to the NIH. All code used for analysis is available upon request at vladimir.roudko@gmail.edu (GitHub: https://github.com/VladimirRoudko).
Ethics statements
Patient consent for publication
Ethics approval
This study involves human participants and was approved by Icahn School of Medicine at Mount Sinai Program for the Protection of Human Subjects IRB #1 - Board B – Registration #IRB00000204 - reviewed 7/9/2024 Study #17-00810. Participants gave informed consent to participate in the study before taking part.
Acknowledgments
We sincerely thank the patients and their families for participating in this study. We extend our gratitude to all the investigators who contributed to this research, including Drs Daniela E Matei, Panagiotis A Konstantinopoulos, Matthew S Block, Andrea Jewell, Stephanie L Gaillard, Michael McHale, Carolyn McCourt, Sarah Temkin, Eugenia Girda, Floor J Backes, Theresa L Werner, Linda Duska, Siobhan Kehoe, and Ilaria Colombo. We are grateful to Dr Beatriz Sanchez-Espiridion and Dr Julia Mendoza Perez for their invaluable assistance with sample procurement and inventory management. Our thanks also go to The Emmes Company, for their organizational and administrative support. We appreciate Rachel Wildman and the Princess Margaret correlative team for their support in conducting the study. We thank Drs Yasuko Tada and Hiroyoshi Nishikawa from the National Cancer Center, Japan, for generously providing several recombinant proteins used in the enzyme-linked immunosorbent assay (ELISA) assays. This study was conducted under the aegis of the CIMAC-CIDC Network, established with support from the Cancer Moonshot Initiative of the NCI. We warmly acknowledge the following members of the Division of Cancer Treatment & Diagnosis for their roles in the selection, coordination, and supervision of this study as part of the CIMAC-CIDC network: program directors Drs Magdalena Thurin and Minkyung Song, associate branch chief Dr Helen X Chen, and Dr Howard Streicher, who served as the lead reviewer and drug monitor.
References
Footnotes
X @EdgarEGK, @cara_haymaker
VR, DMDV, SL and SG contributed equally.
Contributors All authors have contributed to and revised this manuscript. DMDV: Conceptualization; Data analysis, Data collection, Project administration; Supervision; Visualization; Writing—original draft. VR: Conceptualization; Data analysis, Project administration; Supervision; Visualization; Writing—original draft. SL: Conceptualization; Funding acquisition; Project administration; Supervision; Visualization; Writing—original draft. SG: Conceptualization; Funding acquisition; Project administration; Supervision; Visualization; Writing—original draft. KT: Methodology; Data acquisition. MP: Methodology; Data acquisition. XH: Methodology; Data acquisition. GM: Methodology; Data acquisition. JZ: Methodology, Quality control; Statistical feedback. MS-F: Statistical methodology; Visualization; Writing—original draft. LW: Statistical feedback; Project administration. BC: Project administration. SA: Project administration. SK-S: Project administration; Methodology; Data acquisition. All authors: Writing—review and editing. SG is the guarantor.
Funding Scientific and financial support for the Cancer Immune Monitoring and Analysis Centers (CIMAC)-Cancer Immune Data Center (CIDC) Network is provided through the NCI Cooperative Agreements: U24CA224319 to the Icahn School of Medicine at Mount Sinai CIMAC. U24CA224331 to the Dana-Farber Cancer Institute CIMAC. U24CA224285 to the MD Anderson Cancer Center CIMAC. U24CA224316 to the CIDC at Dana-Farber Cancer Institute and through NCI contract 140D0421D0007 to the CIDC operated by NCI. This project was made possible thanks to the support of the 2019 Career Development Award from the American Society of Clinical Oncology/Conquer Cancer Foundation awarded to Dr. Lheureux. We would like to thank the Family of Marion Margaret McCormick for their support in research for endometrial cancer at the Princess Margaret Cancer Foundation. S.G. was additionally supported by grants U01DK124165, R33CA263705, and P30CA196521. This study was coordinated in part by the NCI’s ETCTN and supported by the NCI of the National Institutes of Health (NIH). The content is solely the responsibility of the authors and does not necessarily represent the official views of the NIH. This work was supported in part through the computational and data resources and staff expertise provided by Scientific Computing and Data at the Icahn School of Medicine at Mount Sinai and supported by the Clinical and Translational Science Award grant UL1TR004419 from the National Center for Advancing Translational Sciences.
Competing interests SG reports other research funding from Boehringer-Ingelheim, Bristol-Myers Squibb, Celgene, Genentech, Regeneron, and Takeda, and consulting from Taiho Pharmaceuticals, not related to this study. SL reports other research funding from Roche, AstraZeneca, GSK and Repare Therapeutics and consulting from Roche, AstraZeneca, GSK, Eisai, Merck, Repare, Zai Lab Oncology, Schrodinger and Seagen not related to this study.
Provenance and peer review Not commissioned; externally peer reviewed.
Supplemental material This content has been supplied by the author(s). It has not been vetted by BMJ Publishing Group Limited (BMJ) and may not have been peer-reviewed. Any opinions or recommendations discussed are solely those of the author(s) and are not endorsed by BMJ. BMJ disclaims all liability and responsibility arising from any reliance placed on the content. Where the content includes any translated material, BMJ does not warrant the accuracy and reliability of the translations (including but not limited to local regulations, clinical guidelines, terminology, drug names and drug dosages), and is not responsible for any error and/or omissions arising from translation and adaptation or otherwise.