Article Text

Abstract
Background The transmembrane protein T-cell immunoglobulin and mucin-domain containing molecule 3 (TIM-3) is an immune checkpoint receptor that is expressed by a variety of leukocyte subsets, particularly in the tumor microenvironment. An effective TIM-3-targeting therapy should account for multiple biological factors, including the disease setting, the specific cell types involved and their varying sensitivities to the four putative TIM-3 ligands (galectin-9, phosphatidylserine, high mobility group protein B1 and carcinoembryonic antigen cell adhesion molecule 1), each of which engages a unique binding site on the receptor’s variable immunoglobulin domain. The primary objectives of this study were to assess the prevalence and function of TIM-3+ natural killer (NK) cells in patients with head and neck squamous cell carcinoma (HNSCC), determine whether the four TIM-3 ligands differentially affect TIM-3+ NK cell functions, identify the most immunosuppressive ligand, and evaluate whether targeting ligand-mediated TIM-3 signaling enhances NK cell effector functions.
Methods Single-cell RNA sequencing and flow cytometry were used to study the prevalence, phenotypes and function of TIM-3+ NK cells in HNSCC patient tumors and blood. In vitro killing, proliferation and cytokine production assays were implemented to evaluate whether the four TIM-3 ligands differentially modulate TIM-3+ NK cell functions, and whether disruption of TIM-3/ligand interaction can enhance NK cell-mediated antitumor effector mechanisms. Finally, The Cancer Genome Atlas survival analysis and digital spatial profiling were employed to study the potential impact of etiology-associated differences on patients with HNSCC outcomes.
Results We demonstrate that TIM-3 is highly prevalent on circulating and tumor-infiltrating NK cells. It co-expresses with CD44 and marks NK cells with heightened effector potential. Among the four putative TIM-3 ligands, galectin-9 most consistently suppresses NK cell-mediated cytotoxicity and proliferation through TIM-3 and CD44 signaling, respectively, but promotes IFN-γ release in a TIM-3-dependent manner. Among patients with HNSCC, an elevated intratumoral TIM-3+ NK cell gene signature associates with worse outcomes, specifically in those with human papillomavirus (HPV)+ disease, potentially attributable to higher galectin-9 levels in HPV+ versus HPV− patients.
Conclusions Our findings underscore the complex functional impact of TIM-3 ligand signaling, which is consistent with recent clinical trials suggesting that targeting TIM-3 alone is suboptimal as an immunotherapeutic approach for treating malignancies.
- Tumor Microenvironment
- Head and Neck Cancer
- Natural killer - NK
- Immune Checkpoint Inhibitor
- Innate
Data availability statement
Data are available upon reasonable request. All data relevant to the study are included in the article or uploaded as supplementary information.
This is an open access article distributed in accordance with the Creative Commons Attribution Non Commercial (CC BY-NC 4.0) license, which permits others to distribute, remix, adapt, build upon this work non-commercially, and license their derivative works on different terms, provided the original work is properly cited, appropriate credit is given, any changes made indicated, and the use is non-commercial. See http://creativecommons.org/licenses/by-nc/4.0/.
Statistics from Altmetric.com
WHAT IS ALREADY KNOWN ON THIS TOPIC
The antagonism of T-cell immunoglobulin and mucin-domain containing molecule 3 (TIM-3) signaling has shown therapeutic potential in preclinical cancer models, however translating these findings into the clinic has been challenging. Part of the problem stems from our limited understanding of which TIM-3 ligands are suppressive to specific leukocyte subsets. While phosphatidyseline is widely accepted as a key immunosuppressive ligand for T cells, less is known about the differential impact of these ligands on natural killer (NK) cells, which can also express TIM-3.
WHAT THIS STUDY ADDS
We report that TIM-3 is one of the most readily expressed immune checkpoint receptors on NK cells in patient with head and neck squamous cell carcinoma (HNSCC) blood and tumors, and marks cells with heightened effector potential.
Among the four putative ligands, galectin-9 is the one that most consistently suppresses NK cell-mediated cytotoxicity and proliferation by specifically engaging TIM-3 and CD44, respectively.
It also demonstrates that the current generation of TIM-3 antagonists fails to fully block this suppression, particularly in relation to NK cell proliferation.
An elevated intratumoral TIM-3+ NK cell gene signature in patients with HNSCC is associated with worse outcomes in those with human papillomavirus (HPV)-driven disease etiology, which may be attributable to higher galectin-9 levels in HPV+ versus HPV− patients.
HOW THIS STUDY MIGHT AFFECT RESEARCH, PRACTICE OR POLICY
These findings suggest that targeting TIM-3 alone is suboptimal as an immunotherapeutic approach to block galectin-9-mediated immunosuppression and effectively restore NK cell function. By identifying key mechanisms of immune suppression, this study offers a new strategy for patient selection and therapy design.
Background
T-cell immunoglobulin and mucin-domain containing molecule 3 (TIM-3) is a glycoprotein that was initially identified as a molecule expressed by IFN-γ-producing CD4+ and CD8+ cells.1 TIM-3 expression was later found on macrophages, regulatory T cells, monocytes, and natural killer (NK) cells.2 Due to its immunosuppressive properties, TIM-3 became a highly intriguing target for immunotherapy of cancer.3 4 Although animal studies have demonstrated that TIM-3 antagonism can enhance antitumor immunity,2 translating these findings to the clinic has proven to be very challenging.5 One hurdle in the development of an effective TIM-3-targeting antibody is the promiscuous nature of TIM-3, given its interaction with at least four known ligands: galectin-9, phosphatidylserine (PS), high mobility group protein B1 (HMGB1), and carcinoembryonic antigen cell adhesion molecule 1 (CEACAM1).2 Adding to the complexity, these ligands bind to different structural regions of TIM-3,2 making it very challenging to target all of its immunosuppressive functions. Additionally, the context-dependent immunosuppressive function of these ligands among different leukocytes, as well as the existence of soluble and membrane-bound forms, adds further complexity.2
NK cells are innate cytotoxic and immunoregulatory lymphocytes that play a critical role in tumor immunosurveillance.6 TIM-3 was initially described as an activation and maturation marker for NK cells.7 8 Subsequently, it was identified as one of the key inhibitory checkpoint receptors that drive NK cell dysfunction in various cancer models,9 10 with increased TIM-3 expression on circulating NK cells (cNK) being linked to poor prognosis in patients with lung adenocarcinoma.10 While conflicting data exist on the roles of galectin-9-mediated and PS-mediated immune modulation via TIM-3,8 11 12 little is known about the roles of CEACAM1 and HMGB1 in TIM-3-mediated NK cell immunosuppression.
In the present study, the primary goal was to evaluate whether the four TIM-3 ligands differentially modulate TIM-3+ NK cell functions, identify the dominant immunosuppressive ligand, and assess whether abrogation of TIM-3 signaling can enhance antitumor effector mechanisms of NK cells in the presence of immunosuppressive ligands. We demonstrate that TIM-3 is a predominant NK cell immune checkpoint receptor (ICR), marking cells with higher effector potential in both blood and tumors of patients with head and neck squamous cell carcinoma (HNSCC). Galectin-9 emerged as the only TIM-3 ligand consistently capable of suppressing NK cell cytotoxic and proliferative capacity through differential TIM-3 and CD44 signaling, respectively. Finally, we demonstrate that an increased presence of TIM-3+ NK cells in the HNSCC tumor microenvironment (TME) may be detrimental to patients harboring the human papillomavirus (HPV+), but not those with HPV− malignancies, possibly due to higher intratumoral galectin-9 expression levels. Cumulatively, these data suggest that targeting galectin-9 binding sites on TIM-3 and CD44 or galectin-9 itself may be needed to reinvigorate all NK cell effector functions in patients with HNSCC, particularly those harboring HPV+ lesions.
Methods
Cell lines
K562 cell line was obtained from American Type Culture Collection (Manassas, Virginia, USA). It was cultured in complete media (1X RPMI-1640 supplemented with 10% fetal bovine serum, 1% non-essential amino acids, 1% penicillin/streptomycin and 1% L-glutamine; Thermo Fisher Scientific; Waltham, Massachusetts, USA) at 37°C, in a humidified/5% CO2 atmosphere (37°C/5% CO2) and tested every 6 months for mycoplasma contamination using the GEN-PROBE Mycoplasma Tissue Culture Non-Isotopic Rapid Detection System (Gen-Probe; San Diego, California, USA).
Patients and specimens
Peripheral blood and tumor tissues from treatment-naïve patients with HNSCC were collected with their written consent in accordance with the Declaration of Helsinki, under the University of Pittsburgh Cancer Institute Review Board–approved protocol (HCC# 99–069). Patient characteristics are shown in online supplemental table 1. Blood samples from healthy donors (HD) were acquired from Vitalant (Pittsburgh, Pennsylvania, USA).
Supplemental material
Isolation of tumor-infiltrating and peripheral blood lymphocytes
Tumor tissues were minced in a 6 cm Petri dish (Corning; Corning, New York, USA) in complete media, transferred to a 70 µm cell strainer (BD Biosciences; Franklin Lakes, New Jersey), and mashed using a syringe plunger. Cells that passed through the strainer were collected and washed twice with complete media. Tumor-infiltrating lymphocyte (TIL) was cryopreserved in liquid nitrogen until the time of analysis. Peripheral blood lymphocyte (PBL) was separated from blood by Ficoll-Hypaque gradient centrifugation (GE Healthcare Bioscience; Chicago, Illinois, USA) as previously described.13 PBL were either used fresh or cryopreserved until the time of analysis.
NK cell isolation and activation
NK cells were enriched from freshly obtained HD or patient PBL by negative selection using the human NK Cell Isolation Kit (Miltenyi Biotec; Auburn, California, USA). NK cells were activated in NK cell media (AIM-V, AlbuMAX media+5% human AB serum (Thermo Fisher)) supplemented with 1000 IU/mL rhIL-2 (PeproTech; Cranbury, New Jersey, USA).
TIM-3 ligands used in these studies
Dynabeads M-450 Epoxy (Thermo Fisher) were covalently coupled with recombinant human galectin-9, HMGB1, CEACAM1 (R&D Systems) or bovine serum albumin (BSA; negative control; Thermo Fisher) per manufacturer’s protocol. PS (100% PS) and negative control phosphatidylcholine (PC 99.5% : 0.5% PS) liposomes were obtained from CD Bioparticles (Shirley, New York, USA).
NK cell treatment with TIM-3 ligands
NK cells were activated with 1000 IU/mL interleukin (IL)-2 for 24 hours at 37°C/5% CO2, after which they were collected, recounted and co-cultured with ligand-coated beads at 1:5 cell:bead ratio or with 100 µM liposomes, both in the presence of 1000 IU/mL IL-2 at 37°C/5% CO2 for 24 hours. Subsequently, ligand-coated beads were removed using a DynaMag-2 magnet (Thermo Fisher), while IL-2 and liposomes were washed out by two rounds of centrifugation in NK cell media. For neutralization experiments, activated NK cells were pretreated with 20 µg/mL anti-TIM-3 (F38-2E2 (BioLegend; San Diego, California, USA) or sabatolimab (MBG453; Novartis Institutes for Biomedical Research)) or anti-CD44 (clone Hermes-1; Novus Biologicals; Littleton, Colorado, USA) antibodies for 1 hour at 37°C. Anti-chi-lysozyme immunoglobulin G4 (IgG4) antibody (Novartis) was used as the negative control.
NK cell proliferation assays
Purified NK cells were labeled with 5 µM carboxyfluorescein succinimidyl ester (CFSE; Thermo Fisher) and cultured for 5 days in NK cell media supplemented 1000 IU/mL rhIL-2 in the presence or absence of ligand-coated beads (1:5 cell:bead ratio) or 100 µM PS/PC liposomes. For blocking experiments, 20 µg/mL of anti-TIM-3, anti-CD44 or IgG4 control antibodies were added 30 min before adding IL-2 and ligands. Cell proliferation, as measured by CFSE dilution, was analyzed by flow cytometry.
Flow cytometry and antibodies
NK cells were stained with the Zombie NIR viability dye (BioLegend) at 1:1000 dilution. After washing them in cold fluorescence-activated cell sorting buffer (1X PBS, 0.2% BSA and 0.02% EDTA (Thermo Fisher)), cells were stained with fluorophore-conjugated antibodies (online supplemental table 2) for 20 min at 4°C. For intracellular staining, cells were fixed, permeabilized and stained using the FoxP3 Staining Buffer Set (Miltenyi). Data were collected using the LSRFortessa flow cytometer and analyzed with FlowJo V.10.7.2 (BD Biosciences).
NK-target cell visualization assay-based cytotoxicity assay
One million major histocompatibility complex class I-deficient K562 target cells were cytosolically labeled with 1 µl target cell visualization assay dye (Cell Technologies; Shaker Heights, Ohio, USA) in serum-free media for 15 min at 37°C. After washing, labeled K562 targets were co-cultured with treated NK cells at different effector-to-target ratios for 3 hour at 37°C/5% CO2 in 96-well plates (Costar). The killing was measured by counting the remaining target cells after co-culture using the ImmunoSpot S6 Ultimate analyzer (Cell Technologies).
Small interfering RNA knockdown
NK cells were activated with 1000 IU/mL IL-2 for 24 hours, then transfected with Accell Human SAMRTpool HAVCR2 small interfering RNA (siRNA) or non-targeting control siRNA (Dharmacon; Lafayette, Colorado, USA) in Accell siRNA Delivery Media supplemented with 50 IU/mL IL-2 and 0.5% HuAB serum for 72 hours at 37°C per manufacturer’s instructions. Knockdown of TIM-3 was evaluated by flow cytometry. Cells were subsequently treated with 200 IU/mL IL-2 in the presence or absence of ligand-coated beads for 24 hours and tested for cytotoxicity, with proliferation assessed as described previously.
Single-cell RNA sequencing and bulk RNA sequencing data availability
Unprocessed FASTQ files for our published single-cell RNA sequencing (scRNAseq) data sets14 15 are available on the National Center for Biotechnology Information (NCBI) Sequence Read Archive (BioProject ID PRJNA579178 and PRJNA691564). Processed gene barcode matrices are accessible on the Gene Expression Omnibus database (Accession ID GSE139324 and GSE164690). Characteristics of the 29 patients with HNSCC assessed in these studies are recapitulated in online supplemental table 3. HNSCC The Cancer Genome Atlas (TCGA) bulk RNA sequencing and corresponding clinical data used for survival analysis are downloadable through the Broad Genome Data Analysis Center Firehouse (https://gdac.broadinstitute.org/).
Clustering and cell type assignment
Preprocessing and quality control of scRNAseq data, including normalization and dimension reduction, were performed using the 10X Genomics (Pleasanton, California, USA) Cell Ranger pipeline and Scanpy package (V.1.4.5.post2)16 as previously described.15 A neighborhood graph was used to identify related cells, then Leiden clustering was performed. Cell types were assigned to each cluster based on the top expressed genes in each cluster and known marker genes. T and NK cells were extracted from the full data set and further subclustered using the same methods.
Calculating differentially-expressed genes, TCGA survival analysis, and gene set enrichment analysis
Differentially-expressed genes (DEGs) were calculated using Scanpy’s “rank_genes_group” function with the Wilcoxon test and ranked by z-score. The top 100 DEGs were used to create the TIM-3+ NK cell gene signature from TIL, and gene set variation analysis (GSVA) scores were calculated for each TCGA HNSCC RNAseq sample. Samples were categorized into high and low groups based on the median GSVA score. Kaplan-Meier curves were generated to compare survival between groups, with separate analyses being performed for HPV+ and HPV− patients with HNSCC. Gene set enrichment analysis was performed using the investigated gene sets algorithm from the Molecular Signatures Database to evaluate the enrichment of the top 100 DEGs for TIM-3+ cNK and tiTIL in hallmark pathways.17 18
Digital spatial profiling
Digital spatial profiling (DSP) was performed as previously reported.19 Briefly, 5 µm whole tissue formalin-fixed paraffin-embedded tumor serial sections from 5 HPV− and 6 HPV+ patients (previously evaluated by scRNAseq; online supplemental table 3 were stained for CD3, CD20, pan-cytokeratin (pan-CK) and nucleic acids (Syto13; online supplemental table 4) to elucidate the tissue morphology and select regions of interest (ROI) suitable for analysis. A multiplexed cocktail of antibodies, consisting of the commercially available GeoMX Immune Cell Profiling Panel Human Protein Core for nCounter (NanoString; Seattle, Washington, USA) and a custom antibody against galectin-9 (clone 1G3; Abcam; Waltham, Massachusetts, USA), each incorporating a unique, ultraviolet (UV)-cleavable DNA barcode, was used for labeling. Imaging of sections, selection of ROI, areas of interest (AOI) within selected ROI (tumor vs stroma), and protein profiling were performed using the GeoMX Digital Spatial Profiler (NanoString). Antibody-specific DSP barcodes were UV-cleaved and collected from each ROI. Readout library construction, sequencing and quantification of dissociated barcodes were performed on the nCounter Prep Station and Digital Analyzer (NanoString). Data were spatially mapped back to the original ROI using the GeoMx DSP Analysis Suite (NanoString).
DSP data processing and analysis
nCounter read count matrices underwent quality control, filtering, and normalization. ROI of low nuclei count, low surface area or binding density, low-quality probes, or high background noise were excluded. The remaining data were adjusted using External RNA Controls Consortium (ERCC) spike-in controls and normalized against negative probes to calculate the signal-to-noise ratio followed by log2 transformation following the vendor’s recommendations. Proteins differentially expressed between groups were identified using the Wilcoxon rank sum test. Group contrasts were performed using t-tests with a false-discovery rate (FDR) controlled at 0.05, applying the Benjamini-Hochberg-FDR method for multiple comparisons.
Statistical analysis
Statistical analysis was performed using GraphPad Prism V.10.0 (GraphPad; La Jolla, California, USA). Student’s t-test or Wilcoxon signed-rank test was used for matched sample comparisons, while the Mann-Whitney U test was applied to independent samples as indicated in figure legends. One-way analysis of variance (ANOVA) was used for comparisons among three or more samples, while two-way ANOVA compared means and variances between test groups. Tukey’s multiple comparison test was used in ANOVA to generate confidence intervals for pairwise differences. Differences were considered significant when the value of p was≤0.05.
Results
NK cell activation states are uniquely defined by donor and tissue type
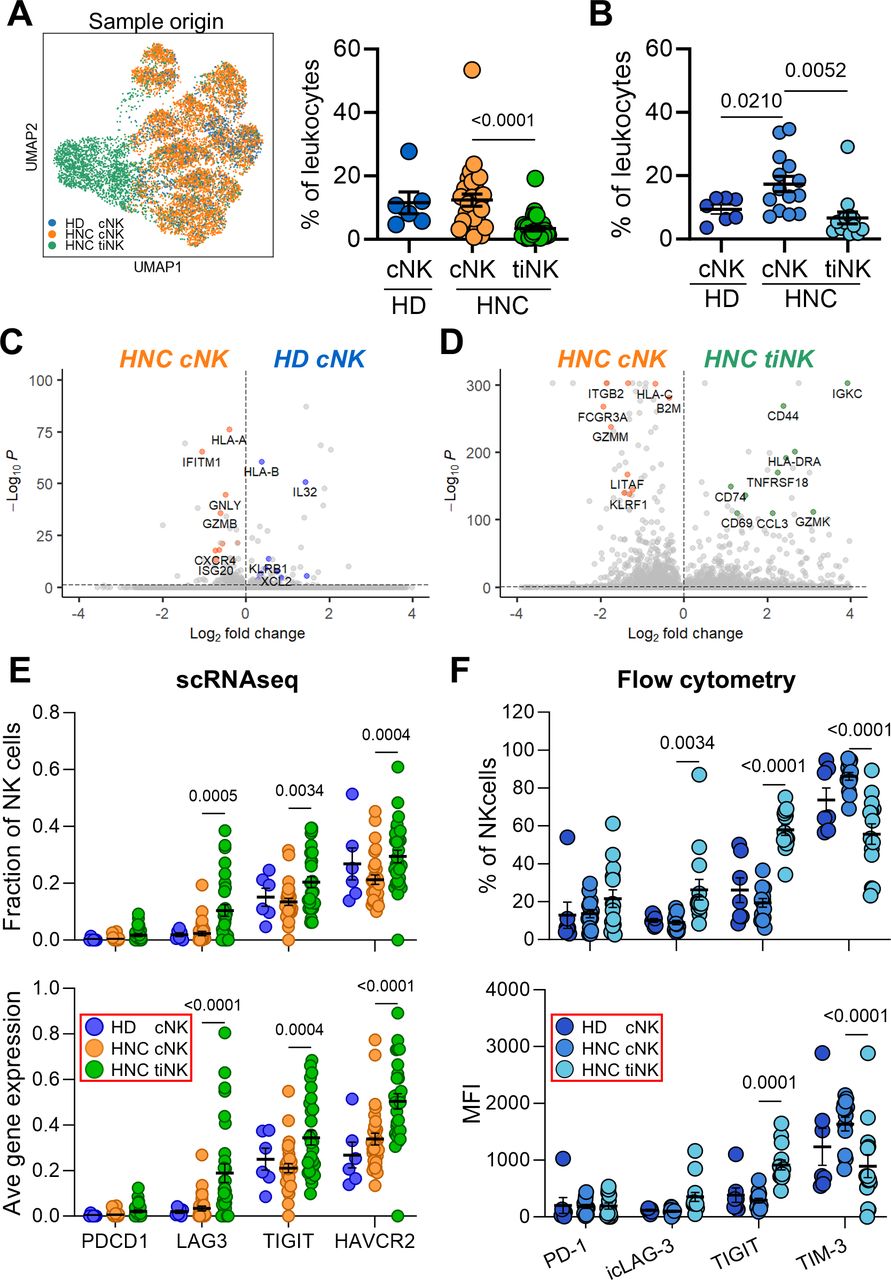
We combined previously published scRNAseq datasets from our group to obtain transcriptional signatures of cNK and tumor-infiltrating NK cells (tiNK) in patients with HNSCC, and cNK from HD.14 15 NK cells, characterized by low CD8A and CD3D, and high NCAM1, NCR1, NCR2 and NCR3 gene expression, were bioinformatically extracted and visualized using a comprehensive Uniform Manifold Approximation and Projection plot (figure 1A; online supplemental figures 1A–D).20 A total of 12,761 NK cells were identified, including 8,056 cNK and 3,375 tiNK from patients, as well as 1,330 HD cNK. NK cells represented 11.5% of HD PBL, 12.4% of HNSCC PBL and 3.4% of HNSCC TIL on average (figure 1A). By flow cytometry, NK cells represented, on average, 9.4% of HD PBL, 17.4% of HNSCC PBL and 6.6% of HNSCC TIL (figure 1B; online supplemental figure 2).

TIM-3 is prevalent in NK cells in PBL (cNK) and TIL (tiNK). (A) NK cells from blood and tumors were bioinformatically extracted from our previously published scRNAseq data sets of healthy donors (HD) and patients with HNSCC (HNC),14 15 and visualized as a UMAP plot. NK cell frequencies within PBL and TIL are also shown (% of leukocytes). (B) cNK and tiNK frequencies identified by scRNAseq were validated by flow cytometry. Transcriptomic differences were highlighted by volcano plots between (C) HNC and HD cNK, and (D) HNC cNK and tiNK, showing DEGs. The inhibitory ICR landscape of cNK and tiNK cells was assessed by (E) scRNAseq and (F) flow cytometry, measuring the fraction of cells expressing each marker or average gene/protein expression levels. Each circle in dot-plot summaries represents a single donor. P values based on Mann-Whitney U (HD vs HNC cNK) and Wilcoxon signed-rank (HNC cNK vs tiNK) tests. cNK, circulating natural killer cells; DEGs, differentially-expressed genes; HNSCC, head and neck squamous cell carcinoma; ICR, immune checkpoint receptor; MFI, mean fluorescence intensity; NK, natural killer; PBL, peripheral blood lymphocyte; scRNAseq, single-cell RNA sequencing; TIL, tumor-infiltrating lymphocyte; TIM-3, T-cell immunoglobulin and mucin-domain containing molecule 3; tiNK, tumor-infiltrating NK cells; UMAP, Uniform Manifold Approximation and Projection.
Consistent with previous publication,21 our scRNAseq analyses revealed divergent gene signatures for cNK and tiNK. We identified 10 cNK and two tiNK clusters (online supplemental figure 1C,D) with distinct gene signatures (online supplemental tables 5–7). Volcano plots were used to highlight transcriptomic differences between aggregated patient and HD cNK, as well as patient cNK and tiNK cell subclusters, by visualizing DEGs. Patient cNK displayed increased expression of genes encoding interferon-inducible (ISG20, IFITM1) and cytolytic (GNLY, GZMB) molecules, while HD NK cells had a proinflammatory signature (IL32, KLRB1, XCL2; figure 1C).22–24 When comparing patient-matched cNK and tiNK (figure 1D), cNK were enriched in genes associated with cytotoxicity (FGFBP2, NKG7, SPON2, GZMM and FCGR3A), while tiNK DEGs linked to activation and tissue residency (JUN, HLA-DRA, FOS, HLA-DRB1, CD69 and CD44),25–28 as well as GZMK, a marker of CD56brightCD16− NK cells.25
To characterize the activation status of patient-matched cNK and tiNK, as well as HD cNK, we analyzed 12 prototypic activating and inhibitor receptors, cytokines and cytotoxic markers by flow cytometry (online supplemental figure 3). CD56+CD3− NK cells from these donors and/or tissue compartments exhibited distinct activation states. Patient cNK displayed significantly higher CD16 (p=0.025) and lower granzyme B (p<0.0001) levels compared with HD cNK. In patient-matched samples, CD16 (p=0.0001), granzyme B (p=0.0067) and perforin (p=0.0006) protein levels were significantly decreased in tiNK versus cNK. Additionally, IFN-γ (p=0.007), CD57 (p=0.0175) and NKG2D (p=0.0001) were more frequently expressed, while TNF (p=0.0002), NKG2A (p=0.0024) and HLA-DR (p=0.0067) were less frequent on tiNK versus cNK. No differences were observed in the frequencies of KIR-expressing NK cells (online supplemental figure 3).
TIM-3 is a prevalent ICR expressed by both cNK and tiNK
Since inhibitors for PD-1,29 LAG-3,30 TIGIT31 and TIM-35 are currently being used or tested as treatments for HNSCC, we examined the transcriptomic landscape of these ICR in HNSCC cNK and tiNK, as well as in HD cNK, using scRNAseq data. While PDCD1 (PD-1) was expressed at low levels, LAG3 (LAG-3), TIGIT and especially HAVCR2 (TIM-3) were the prominent ICR expressed by cNK and, especially, tiNK based on the fraction of expressing cells and average gene expression (figure 1E). No significant differences were observed between HD and HNSCC cNK (figure 1E).
Flow cytometry was used to validate and extend scRNAseq findings. Since LAG-3 was not readily detectable on NK cells (online supplemental figure 3B), and is known for subcellular localization in T cells,32 we evaluated its intracellular stores (intracellular LAG-3 (icLAG-3)). Among the four ICRs evaluated, TIM-3 was the most frequently expressed ICR on cNK, particularly in HNSCC, with average frequencies of 73.7% in HD and 86.1% in HNSCC, and corresponding mean fluorescence intensity (MFI) values of 1,236 and 1,635 (online supplemental figure 2B; figure 1F). tiNK displayed increased expression of icLAG-3 (8.96% vs 26.3%; MFI 352 vs 99.5) and TIGIT (19.3% vs 57.9%; MFI 288 vs 914), but lower expression of TIM-3 (86.1% vs 55.7%; MFI 1,635 vs 894; figure 1F) versus patient-matched cNK. Despite the lower frequency of TIM-3+ NK cells in tumors, it was comparable to that of TIGIT+ NK cells. This, alongside the predominant expression of TIM-3 in cNK, implicates TIM-3 as a key ICR expressed by NK cells in patients with HNSCC.
CD56dimCD16dim/−TIM-3low NK cells predominate the HNSCC TME
Given the lower TIM-3 expression on tiNK versus cNK, we investigated whether this difference was due to distinct NK cell subset distributions within these tissues. Human NK cells can be segregated into at least three major subsets based on CD56 and CD16 expression: CD56brightCD16− (regulatory), CD56dimCD16+ (cytotoxic), and CD56dimCD16dim/− (intermediate regulatory/cytotoxic).33–36 Flow cytometric analysis (figure 2A,B) revealed a higher frequency of CD56dimCD16+ (37% vs 56%), and concurrent decrease of CD56dimCD16dim/− NK cells (52% vs 32%; p=0.025) in patient cNK compared with HD cNK. In patient-matched samples, tiNK had increased frequencies of CD56brightCD16− (6.5% vs 21%; p=0.0004) and, especially, CD56dimCD16dim/− NK cells (32% vs 67.6%; p=0.0001), at the cost of CD56dimCD16+ NK cells (56% vs 8.6%; p=0.0001) compared with cNK.

CD56dimCD16dim/− NK cells, predominant in HNSCC tumors, express the lowest TIM-3 levels among subsets. NK cell subsets were profiled by CD56 and CD16 expression using flow cytometry (online supplemental figure 2). (A) Representative CD56/CD16 staining in HD cNK, HNSCC cNK and HNSCC tiNK is shown. (B) The distribution of the three major NK cell subsets in cNK and tiNK is summarized. (C) TIM-3 staining examples for patient-matched cNK and tiNK subsets (pt.14; online supplemental table 1) are shown. TIM-3 expression, measured by (D) the frequency of TIM-3+ cells and (E) the mean fluorescence intensity (MFI), is shown for the three major NK subsets in cNK and tiNK, as assessed by flow cytometry. Each circle in dot-plot summaries represents a single donor. P values based on Mann-Whitney U (HD vs HNC cNK) and Wilcoxon signed-rank (HNC cNK vs tiNK) tests. cNK, circulating natural killer cells; HD, healthy donors; HNC, patients with HNSCC; HNSCC, head and neck squamous cell carcinoma; NK, natural killer; PBL, peripheral blood lymphocyte; TIL, tumor-infiltrating lymphocyte; TIM-3, T-cell immunoglobulin and mucin-domain containing molecule 3; tiNK, tumor-infiltrating NK cells.
Based on flow cytometry data (figure 2C–E), TIM-3 expression was highest on CD56brightCD16− (averages of 59.9%, 62.0% and 66.4% with average MFI of 1,711, 2,048 and 2,713 for HD cNK, patient cNK and tiNK, respectively) and CD56dimCD16+ NK cells (averages of 75.9%, 81.9% and 51.1% with average MFI of 2,247, 2,566 and 2,349 for HD cNK, patient cNK and tiNK, respectively; figure 2D,E). TIM-3 expression notably decreased on patient-matched CD56dimCD16+ tiNK versus cNK (p<0.0001). The lowest TIM-3 expression was observed on CD56dimCD16dim/− NK cells, with no significant difference between patient-matched cNK and tiNK (averages of 22.8%, 35.3% and 39.4% with average MFI of 1,316, 1,423 and 1,211 for HD cNK, patient cNK and patient tiNK, respectively; figure 2D,E). This, along with the predominance of CD56dimCD16dim/− NK cells in the HNSCC TME (figure 2B), explains the lower overall TIM-3 levels on tiNK compared with cNK (figure 1D).
TIM-3+ NK cell subsets exhibit distinct activation profiles in blood and tumor
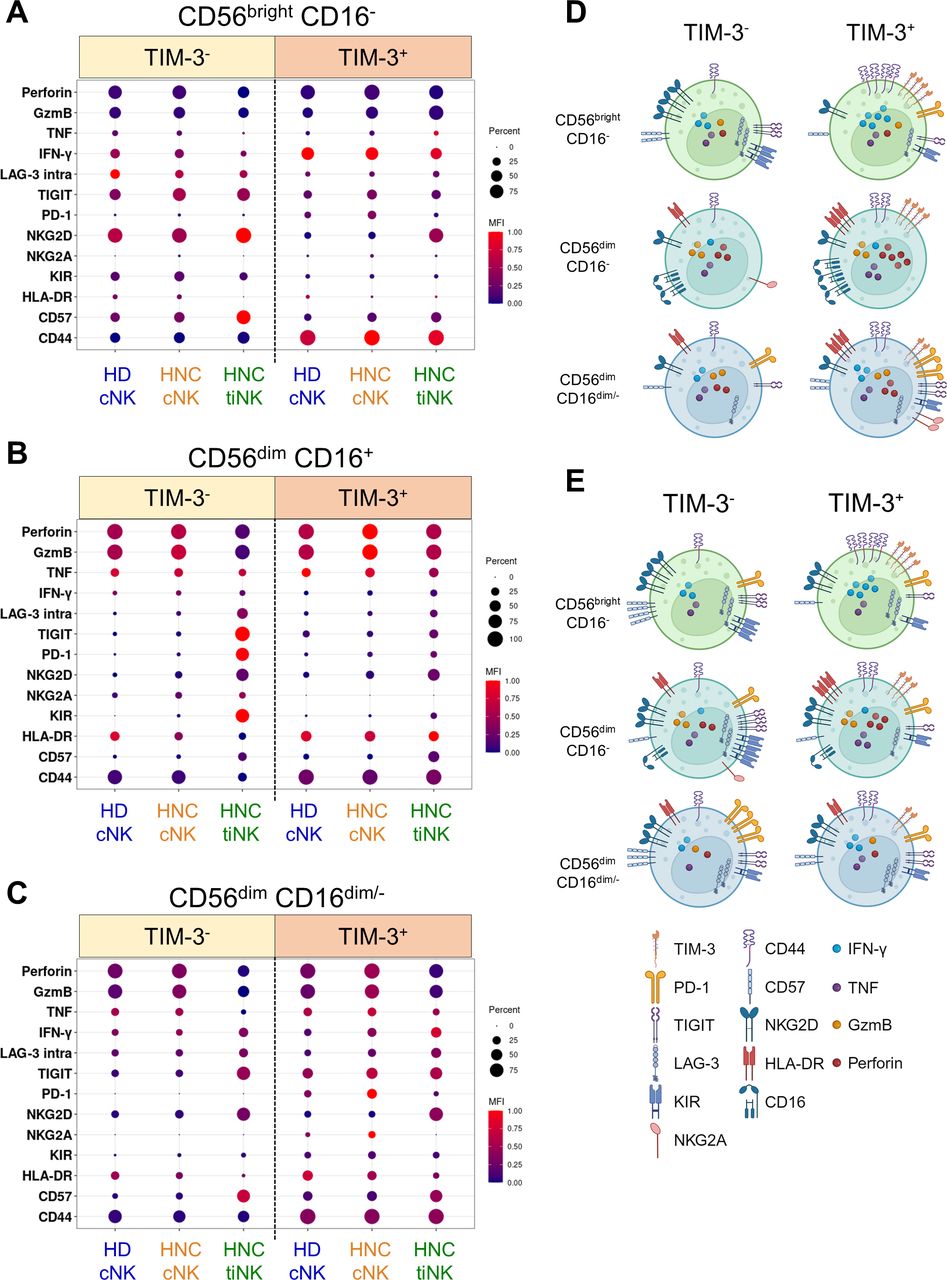
Using 14 activation and suppression markers, we assessed the activation states of the three major NK cell subsets based on TIM-3 expression (figure 3; online supplemental figures 4–6). In HD and patient cNK, CD56brightCD16− cells had higher regulatory potential (high IFN-γ/TNF, low granzyme B/perforin), CD56dimCD16+ cells showed enhanced cytotoxic potential (elevated granzyme B/perforin, reduced IFN-γ), and CD56dimCD16dim/− cells displayed an intermediate profile (moderate expression of IFN-γ, TNF, granzyme B and perforin). No significant differences were observed between HD and HNSCC NK cell subsets (online supplemental figure 4). However, tiNK displayed altered profiles: CD56brightCD16− cells retained cytokine production, CD56dimCD16+ cells exhibited reduced cytotoxic potential (decreased granzyme B/perforin), while CD56dimCD16dim/− cells displayed reduced cytotoxic potential and elevated cytokine production (decreased granzyme B/perforin, increased IFN-γ expression; online supplemental figure 4). TIM-3 expression on all NK cell subsets was linked to higher regulatory and/or effector potential, both in circulation and tumor, based on increased granzyme B, perforin and IFN-γ expression (online supplemental figure 4).

TIM-3 marks NK cells with higher effector potential in blood and tumors. Flow cytometry compared TIM-3+ and TIM-3− NK cells from HD cNK, HNSCC cNK and HNSCC tiNK. Median antigen frequency and scaled expression values for 7 HD cNK, as well as 14 HNC patient-matched cNK and tiNK are visualized using dot plots (explored in greater detail in online supplemental figures 4-6). Circle size represents median frequency, and color indicates scaled median MFI values. Summaries for (A) CD56brightCD16−, (B) CD56dimCD16+ and (C) CD56dimCD16dim/− NK cells are shown. Graphical summaries of TIM-3− and TIM-3+ (D) cNK and (E) tiNK phenotypes were created with BioRender.com. cNK, circulating natural killer cells; HD, healthy donors; HNC, patients with HNSCC; HNSCC, head and neck squamous cell carcinoma; MFI, mean fluorescence intensity; NK, natural killer; TIM-3, T-cell immunoglobulin and mucin-domain containing molecule 3; tiNK, tumor-infiltrating NK cells.
Evaluation of activation (HLA-DR, CD44, CD16), maturation/memory (CD57, NKG2D, NKG2A), and inhibitory receptors (PD-1, TIGIT, icLAG-3, KIR2DL3; online supplemental figures 5–6) revealed intricate associations between TIM-3 expression, tissue localization and NK cell subsets. HLA-DR and CD44 were consistently higher on TIM-3+ versus TIM-3− NK cell subsets, regardless of tissue localization. CD16 expression was elevated on TIM-3+ CD56dimCD16+ cNK in both HD and patients, but lower in tumors irrespective of TIM-3 status. Conversely, CD57 and NKG2D were more frequently expressed on TIM-3− versus TIM-3+ CD56brightCD16− cNK and tiNK, while NKG2A was uncommon on this subset. CD57 and NKG2D were also present on CD56dimCD16+ and CD56dimCD16− tiNK, independent of TIM-3 status. NKG2A was more commonly found on TIM-3− CD56dimCD16+ cNK and tiNK, as well as on TIM-3+ CD56dimCD16− patient cNK, but not tiNK (online supplemental figure 5). In the context of CD57+NKG2D+NKG2A− memory-like NK cells,37 our findings suggest that TIM-3 is frequently found on CD56dimCD16+ memory-like NK cells, but is generally absent on CD56brightCD16− and CD56dimCD16− memory-like NK cells.
Assessment of inhibitory receptor expression on NK cell subsets in relation to TIM-3 expression revealed added complexity (online supplemental figure 6). In CD56brightCD16− NK cells, PD-1 was primarily expressed on TIM-3+ cells across all tissues, while TIGIT, icLAG-3 and KIR2DL3 were more highly expressed on TIM-3− cells. CD56dimCD16+ NK cells exhibited consistent inhibitory receptor expression patterns: PD-1, TIGIT, icLAG-3, and KIR2DL3 were uncommon in blood, but prominently expressed on TIM-3− tiNK (online supplemental figure 6). CD56dimCD16dim/− NK cells also had distinct inhibitory receptor profiles. PD-1 was highest on TIM-3+ cNK, especially in patients. TIGIT was highly expressed on TIM-3+ cNK, as well as on tiNK but in a TIM-3-agnostic manner. icLAG-3 levels were highest in tiNK, independent of TIM-3 expression. KIR2DL3 was elevated on TIM-3+ cNK, especially in patients, but showed no significant difference on tiNK (online supplemental figure 6).
Galectin-9 suppresses NK cell cytotoxicity and proliferation
While galectin-9, HMGB1, CEACAM1, and PS are reported to affect immune cell functions by engaging TIM-3,2 38 39 their impact on NK cells remains unclear.38 We sought to determine which, if any, of these ligands suppress NK cell effector functions. To investigate this, we used galectin-9, HMGB1 or CEACAM1-coated beads (online supplemental figure 7A), as well as PS liposomes, with BSA-coated beads (“Empty”) and PC liposomes (“PC”) serving as respective negative controls. While previous NK cell studies have tested soluble forms of TIM-3 ligands,8 11 more recent research has demonstrated that cell surface-bound ligands may be more effective at mediating TIM-3 signaling.40 We chose bead-bound and liposome-integrated ligands to better mimic physiological cell–cell interactions, as they provide stable, localized receptor engagement, facilitate ligand clustering for optimal signaling, and offer reproducible surface densities for consistent results.
IL-2-activated NK cells from HD and patient PBL were used for these assays. As reported,7 IL-2 activation led to time-dependent upregulation of TIM-3 (online supplemental figure 7B), coinciding with increased activation of all NK cell subsets as measured by elevated CD69 expression (online supplemental figure 7C), granzyme B, perforin and Ki-67 (online supplemental figure 7D). Among the four ligands examined, only galectin-9 consistently suppressed the cytotoxic (figure 4A,B) and proliferative (figure 4C,D) capacities of IL-2-activated NK cells, without inhibiting IFN-γ or TNF release (online supplemental figure 8A,B). Notably, galectin-9 induced IFN-γ release in 5/7 patients tested (median IFN-γ concentrations of 555 and 1,532 pg/mL for BSA and galectin-9 groups, respectively), although this trend did not reach statistical significance. Galectin-9 ligation attenuated the cytotoxic and proliferative mechanisms of IL-2-activated TIM-3+ NK cells compared with control beads, as evidenced by reduced perforin, granzyme B and Ki-67 (figure 4E).

Galectin-9 consistently suppresses NK cell proliferation and cytotoxicity. To induce TIM-3 cross-linking and immunosuppressive signaling, we used (A) galectin-9, HMGB1 and CEACAM1-coated beads, and (B) phosphatidylserine (PS) liposomes. BSA-coated beads (BSA) and phosphatidylcholine (PC) liposomes served as respective negative controls. (A–B) Limited NK cell yields from patients with HNSCC (≤4.35 million per 25 million PBL) restricted cytotoxicity tests to four or five conditions per patient. For the representative panel, HD NK cells isolated from a buffy coat were used to test all conditions. Cytotoxicity of IL-2 activated, ligand-treated NK cells from HD was tested against MHC class I-deficient K562 targets using the NK-TVA assay. Data are representative of six independent experiments, four of which were performed using HNSCC and two using HD NK cells. (C–D) For proliferation and cytokine-release experiments, which required fewer cells, we used only patient-derived NK cells. (C) The impact of the four TIM-3 ligands on patient with HNSCC NK cell proliferation was evaluated by CFSE dilution. (D) Proliferation data from six independent experiments are summarized. (E) The mechanism behind galectin-9-induced suppression of NK cell cytotoxicity and proliferation was evaluated by flow cytometric analysis of granzyme B, perforin and Ki-67 expression levels (representative of three independent experiments). Two-way and one-way ANOVA tests were used for statistical analyses in (A, B) and (D), respectively. ANOVA, analysis of variance; BSA, bovine serum albumin; CEACAM1, carcinoembryonic antigen cell adhesion molecule 1; CFSE, carboxyfluorescein succinimidyl ester; E:T, effector-to-target; HD, healthy donors; HMGB1, high mobility group protein B1; HNSCC, head and neck squamous cell carcinoma; IgG, immunoglobulin G; IL-2, interleukin-2; MFI, mean fluorescence intensity; MHC, major histocompatibility complex; NK, natural killer; TIM-3, T-cell immunoglobulin and mucin-domain containing molecule 3; TVA, target cell visualization assay.
Galectin-9-induced cytotoxic and proliferative dysfunction of NK cells is mediated by TIM-3 and CD44, respectively
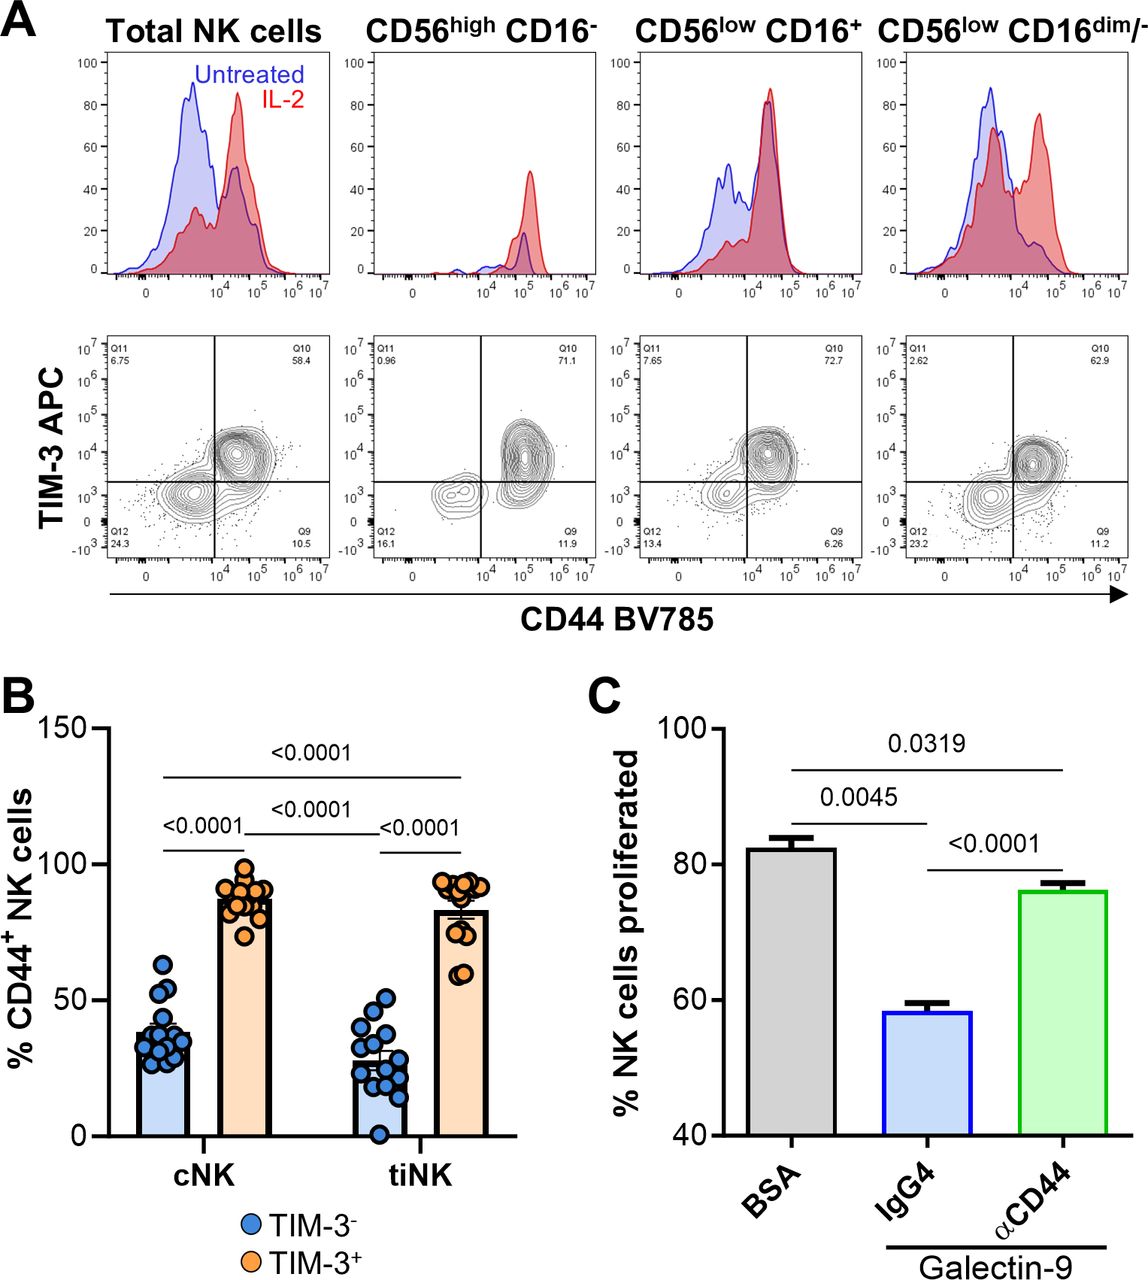
To determine if TIM-3 mediates galectin-9-induced dysfunction, we used anti-TIM-3 antibodies F38-2E2 and sabatolimab, an antibody reported to abrogate galectin-9-mediated effects.41 While F38-2E2 failed to block galectin-9-induced suppression of NK cell-mediated cytotoxicity, sabatolimab was effective, particularly at higher effector-to-target ratios (figure 5A). In support of this, TIM-3 knockdown via small interfering RNA (siRNA; figure 5B) fully reversed galectin-9-induced suppression of NK cell cytotoxicity (figure 5C). Additionally, TIM-3 blockade with sabatolimab abrogated galectin-9-induced IFN-γ release (online supplemental figure 8C). Surprisingly, neither F38-2E2 nor sabatolimab counteracted galectin-9-induced suppression of NK cell proliferation (figure 5D), suggesting involvement of another receptor. We hypothesized that CD44, a known galectin-9 receptor42 that strongly associates with TIM-3 (figure 3), might mediate the observed proliferative dysfunction. IL-2 activation upregulated both CD44 and TIM-3 on all NK cell subsets (figure 6A). In cNK and tiNK, TIM-3 and CD44 strongly co-expressed (figure 6B). Anti-CD44 antibody treatment nearly completely reversed galectin-9-induced suppression of NK cell proliferation (p<0.0001; figure 6C). Cumulatively, our findings suggest that galectin-9 may exert distinct suppressive effects through different receptors.

Sabatolimab counteracts galectin-9-induced dysfunction of NK cell cytotoxicity but not proliferation. Sabatolimab (SAB) or F38-2E2 (2E2) anti-TIM-3 antibodies, along with an IgG4 isotype control, were tested for their ability to block TIM-3/galectin-9 interactions. The effects on (A) cytotoxicity and (D) proliferation were assessed using NK-TVA and CFSE dilution assays, respectively. (B) The efficacy of TIM-3 knockdown via siRNA was compared with the non-targeting (NT) siRNA control (n=2). (C) Post-knockdown NK cells were treated with BSA-coated or galectin-9-coated beads to evaluate cytotoxicity. Two-way and one-way way ANOVA tests were used for statistical analyses in (A) and (D), respectively. Data are representative of three independent experiments. ANOVA, analysis of variance; BSA, bovine serum albumin; CFSE, carboxyfluorescein succinimidyl ester; E:T, effector-to-target; IgG4, immunoglobulin G4; MFI, mean fluorescence intensity; NK, natural killer; siRNA, small interfering RNA; TIM-3, T-cell immunoglobulin and mucin-domain containing molecule 3; TVA, target cell visualization assay.

Galectin-9 suppresses NK cell proliferation via CD44 signaling. (A) Flow cytometry analysis of CD44 upregulation and its co-expression with TIM-3 on NK cells after the 48 hours treatment with 6000 IU/mL IL-2. Data are representative of three independent experiments. (B) Frequencies of CD44+ cells among TIM-3+ and TIM-3− patient-matched cNK and tiNK are summarized. (C) The ability of anti-CD44 and IgG4 isotype control antibodies to abrogate galectin-9-induced suppression of NK cell proliferation was assessed using the CFSE dilution assay. Data are representative of two independent experiments. Statistical significance was determined using one-way ANOVA for (B) and (C). ANOVA, analysis of variance; BSA, bovine serum albumin; CFSE, carboxyfluorescein succinimidyl ester; cNK, circulating natural killer cells; IgG4, immunoglobulin G4; IL-2, interleukin-2; NK, natural killer; TIM-3, T-cell immunoglobulin and mucin-domain containing molecule 3; tiNK, tumor-infiltrating NK cells.
TIM-3+ NK cell gene signature predicts poor clinical outcome in HPV+ patients with HNSCC
To assess the potential impact of TIM-3-expressing tiNK on overall survival, a gene signature was derived from scRNAseq analysis, comparing the top 100 DEGs between HAVCR2-positive and HAVCR2-negative tiNK (online supplemental table 8), and applied to survival analysis using the TCGA HNSCC cohort. Patients were stratified into high and low groups based on gene signature scores using the GSVA package. A high score for the HAVCR2+ tiNK gene signature was significantly associated with poor overall survival in HPV+ (p=0.021), but not in HPV− patients (figure 7A). These results suggest that TIM-3+ tiNK may contribute to disease progression in HPV+ patients.

Potential importance of disease etiology: galectin-9 is more highly expressed in HPV+ HNSCC. (A) Gene signatures for HAVCR2+ tiNK, derived from the top 100 DEGs, were used to stratify TCGA HNSCC samples into high and low TIM-3+ tiNK gene signature groups based on the median GSVA score. Kaplan-Meier survival curves are shown for HPV+ and HPV− patients. (B) Flow cytometry analysis of TIM-3+ NK cell frequencies in patient-matched cNK and tiNK, and HD cNK. (C) LGALS9 expression levels in HPV− and HPV+ patients with HNSCC from TCGA, with individual patient values plotted. Statistical significance was determined using the Mann-Whitney test. (D–E) Tumor sections from five HPV− and six HPV+ patients were evaluated by DSP. (D) CD3, CD20, pan-CK and nucleic acid staining were used to select ROI (∼500 µm2) and AOI (based on pan-CK staining → stroma vs tumor bed). A staining example for one patient is shown. (E) Relative galectin-9 protein abundance was measured in AOI with a multiplexed antibody cocktail and custom UV-cleavable DNA barcode. Data are shown as log2(normalized counts), with each dot representing an AOI and color indicating the patient. Statistical significance was calculated using Wilcoxon’s test for (E) and Student’s t-test for (B) and (C). AOI, areas of interest; cNK, circulating natural killer cells; DEGs, differentially-expressed genes; DSP, digital spatial profiling; GSVA, gene set variation analysis; HD, healthy donors; HNC, patients with HNSCC; HNSCC, head and neck squamous cell carcinoma; HPV, human papillomavirus; MFI, mean fluorescence intensity; NK, natural killer; pan-CK, pan-cytokeratin; ROI, regions of interest; TCGA, The Cancer Genome Atlas; TIM-3, T-cell immunoglobulin and mucin-domain containing molecule 3; tiNK, tumor-infiltrating NK cells; TLS, tertiary lymphoid structures; UV, ultraviolet.
HPV+ HNSCC tumors express higher levels of galectin-9 than HPV− ones
The TCGA analysis suggests that TIM-3+ tiNK’s negative impact on patient outcomes may be influenced by disease etiology, potentially due to elevated TIM-3 expression on cNK and tiNK, and/or higher galectin-9 expression in HPV+ versus HPV− tumors. To assess the former possibility, we measured TIM-3 expression on cNK and tiNK from HPV+ and HPV− patients by flow cytometry. Average TIM-3+ NK cell frequencies and TIM-3 expression levels on cNK and tiNK were comparable among HPV+ and HPV− patients (figure 7B), suggesting that HPV etiology does not promote increased TIM-3 expression on NK cells.
Conversely, LGALS9/galectin-9 expression was significantly higher in HPV+ versus HPV− HNSCC tumors from the TCGA cohort (p=0.0002; figure 7C). To confirm this, we assessed 11 patients (6 HPV+ and 5 HPV−) from the scRNAseq cohort (online supplemental table 3) using DSP. ROI was selected based on expression patterns for CD3, CD20, pan-CK and nuclear stain (figure 7D). We extracted 299 AOI from 195 ROI: 154 from stromal and 145 from tumor regions. Levels of galectin-9 and CD56 were measured in selected AOI from the four identified cellular regions: pan-CK-negative (“tumor-adjacent”) tertiary lymphoid structures (TLS), tumor-adjacent non-TLS (“stroma”), pan-CK-positive (“intratumoral”) TLS and intratumoral non-TLS (“tumor bed”) regions. Using log-scaled data, galectin-9 expression was higher in tumor beds (p=3.16×10⁻⁸) and tumor-adjacent TLS (p=0.0022) in HPV+ versus HPV− biopsies (figure 7E). Galectin-9 expression positively correlated with CD56 expression in tumor-adjacent/stromal (pan-CK-negative) non-TLS regions in both HPV− (R=0.41; p=0.015) and HPV+ tumors (R=0.47; p=3.4×10⁻⁵), but not in TLS regions (online supplemental figure 9). Correlations were also noted in intratumoral TLS of HPV− patients (R=0.64; p=0.03) and in tumor beds of HPV+ patients (R=0.22; p=0.053; online supplemental figure 9). These findings suggest that galectin-9 expression is higher in tumor-adjacent TLS and tumor beds of HPV+ versus HPV− lesions, and that NK cells aggregate in galectin-9+ cellular regions.
Finally, we sought to determine whether increased LGALS9 expression is associated with a prognosis distinct from that of HAVCR2+ NK cells in HPV+ patients with HNSCC (figure 7A). Analysis of the TCGA HNSCC cohort showed that higher LGALS9 expression is linked to better survival probabilities in both HPV− and HPV+ patient cohorts (online supplemental figure 10). A possible explanation for these observations could be that high galectin-9 expression by solid tumors has been linked to both increased lymphocyte infiltration and longer overall survival (eg, lung, colorectal, melanoma).43 These findings suggest that while galectin-9 may be associated with a favorable TME, the association of HAVCR2+ NK cells with HPV+ tumors could represent an independent mechanism that may negatively impact patient outcomes.
Discussion
Decreased NK cell infiltration and function are associated with worse survival in patients with cancers, including HNSCC.44 Suppression of NK cell antitumor functions frequently results from interactions between ICR and immune checkpoint ligands.44 We found TIM-3 to be one of the most readily expressed ICR on all major cNK and tiNK subsets, commonly co-expressing with CD44. TIM-3+ NK cells display heightened effector potential, with increased expression of granzyme B, perforin and IFN-γ. This supports a previous report that associated increased TIM-3 expression on cNK with enhanced cytotoxic capacity.45 The co-expression of other activating and inhibiting receptors alongside TIM-3 varies by NK cell subset and tissue of origin, underscoring the nuanced regulation of activating and inhibitory receptors in the context of NK cells.
We also show that CD56dimCD16dim/− cells are the most prevalent tiNK subset in HNSCC tumors. This highly heterogeneous population expresses the lowest levels of TIM-3 and possesses an intermediate regulatory/cytotoxic profile. Known for their IFN-γ production in response to tumors, CD56dimCD16dim/− NK cells exhibit a diverse chemokine receptor profile, making them highly chemotactic.35 Our data reveal that CD56dimCD16dim/− cNK and tiNK have divergent profiles, although the functional differences between these subsets remain unclear and warrant further investigations.
Efforts to target TIM-3 clinically have had limited success.5 To rationally design a TIM-3-targeting therapy, it is necessary to account for multiple factors, including the cell types being targeted and their differential sensitivities to the four known TIM-3 ligands, each binding to a distinct binding site on TIM-3’s variable immunoglobulin domain.2 Our findings demonstrate that galectin-9 is the dominant immunoinhibitory TIM-3 ligand in NK cells, directly suppressing cytolytic mechanisms and proliferation without negatively affecting regulatory functions. These observations seem to reconcile a previous report suggesting that galectin-9 induces IFN-γ release8 with the notion that galectin-9/TIM-3 interaction promotes immune tolerance by impeding cytotoxicity.11 46
In our in vitro stimulation studies, we used bead-bound and liposome-integrated ligand systems to mimic cell–cell interactions more accurately. While direct quantification of galectin-9 at the single-cell level in HNSCC is unavailable, serum galectin-9 concentrations in nasopharyngeal carcinoma (∼3 ng/mL) provide a general reference.47 Based on these data, our experimental setup, which used bead-bound galectin-9 to deliver approximately∼0.38 pg per cell, falls within a range likely to be physiologically relevant.
Most clinical anti-TIM-3 antibodies block PS binding to the FG-CC’ cleft,48 while galectin-9 binds to an adjacent glycan-binding site.2 Although sabatolimab uniquely abrogates both PS and galectin-9-induced dysfunction,41 its combination with chemotherapy in phase II and III trials showed no significant improvement in response and survival rates in blood cancers.5 Our data reveal that galectin-9 suppresses NK cell-mediated cytotoxicity via TIM-3 and proliferation through CD44 signaling. This discovery is clinically significant as it may partially explain the limited efficacy of sabatolimab and, potentially, other TIM-3-targeting antibodies in trials.
TCGA data reveal that increased tumor infiltration by TIM-3+ tiNK may adversely affect survival in HPV+, but not HPV− HNSCC, possibly due to elevated galectin-9 expression in HPV+ patients. Both TCGA and DSP data confirm higher galectin-9 expression in HPV+ versus HPV− HNSCC lesions. Additionally, CD56 and galectin-9 co-expression observations suggest that NK cells congregate in areas of high galectin-9 expression, particularly in the tumor stroma of both HPV+ and HPV− lesions, intratumoral TLS in HPV− patients and in the tumor bed of HPV+ patients, possibly interacting with fibroblasts, tumor cells and other myeloid cells that express high levels of galectin-9.15 The higher galectin-9 levels in HPV+ patients likely lead to more frequent and robust galectin-9/TIM-3 interactions within TME, potentially resulting in higher tiNK dysfunction.
In summary, these studies provide much-needed insight into the strategic development of novel immune checkpoint inhibitor combination therapies. The data suggest potential advantages of targeting TIM-3/CD44 or galectin-9 in HPV+ HNSCC, as these modalities may more effectively reinvigorate innate and, possibly, adaptive effector cells.
Supplemental material
Data availability statement
Data are available upon reasonable request. All data relevant to the study are included in the article or uploaded as supplementary information.
Ethics statements
Patient consent for publication
Ethics approval
Not applicable.
Acknowledgments
We kindly thank the NanoString digital spatial profiling (DSP) Technology Access Program (TAP; Liuliu Pan and Yan Liang in particular) for generating DSP data, as well as Viviana Cremasco, PhD from Novartis Institutes for Biomedical Research for providing us with the MBG453/sabatolimab anti-T-cell immunoglobulin and mucin-domain containing molecule 3 antibody. We thank F Mu for the technical assistance on the HTC cluster.
References
Footnotes
X @RiyueSunnyBao, @robertferrismd
JW and HL contributed equally.
Contributors Conceptualization: JW, HL, RLF, LV. Methodology: JW, HL, RLF, LV. Flow cytometry and in vitro stimulation assays: JW, HL, OVO, LV. Single-cell RNA sequencing and The Cancer Genome Atlas data analysis: AK, JLA, and PU. Digital spatial profiling planning and analysis: TCB, LV, RB. Supervision: RLF, LV. Writing—original draft: JW, JLA, RLF, and LV. Writing—discussion, review and editing: HB, LPK, LMRBA, and XZ. LV is the guarantor of this study.
Funding We acknowledge the following HCC shared resources (supported in part by NIH P30CA047904; R.L.F.): Flow Cytometry Facility, Cancer Bioinformatics Services (CBS), Luminex Core Laboratory and Cancer Genomics Facilities. This research was supported in part by the University of Pittsburgh Center for Research Computing, RRID:SCR_022735, through the resources provided. Specifically, this work used the HTC cluster, which is supported by NIH award number S10OD028483. Research funding: National Institutes of Health grant R01 DE031947 (LV, RLF), National Institutes of Health grant R01 CA206517 (LPK and RLF), National Institutes of Health Head and Neck SPORE P50 CA097190-17 (RLF) and National Institutes of Health grant R01 DE031729 (RB).
Competing interests RLF is co-founder and stockholder of Novasenta, and declares competing interests with Aduro Biotech (consulting), AstraZeneca/MedImmune (clinical trial, research funding), Bristol Myers Squibb (advisory board, clinical trial, research funding), EMD Serono (advisory board), MacroGenics (advisory board), Merck (advisory board, clinical trial), Novasenta (consulting, stock, research funding), Numab Therapeutics AG (advisory board), Pfizer (advisory board), Sanofi (consultant), Tesaro (research funding) and Zymeworks (consultant). TCB serves on the scientific advisory board of Walking Fish Therapeutics, Bespoke Therapeutics, Mestag Therapeutics, Kalivir Therapeutics, and Galvanize Therapeutics. TCB is a consultant for Attivare Therapeutics and Tabby Therapeutics. LV declares US Patent Number: 10,543,264, a methodology licensed to INmune Bio where DN-TNF can be used to prevent or treat malignancies. RB declares PCT/US15/612657 (Cancer Immunotherapy), PCT/US18/36052 (Microbiome Biomarkers for Anti-PD-1/PD-L1 Responsiveness: Diagnostic, Prognostic and Therapeutic Uses Thereof), PCT/US63/055227 (Methods and Compositions for Treating Autoimmune and Allergic Disorders).
Provenance and peer review Not commissioned; externally peer reviewed.
Supplemental material This content has been supplied by the author(s). It has not been vetted by BMJ Publishing Group Limited (BMJ) and may not have been peer-reviewed. Any opinions or recommendations discussed are solely those of the author(s) and are not endorsed by BMJ. BMJ disclaims all liability and responsibility arising from any reliance placed on the content. Where the content includes any translated material, BMJ does not warrant the accuracy and reliability of the translations (including but not limited to local regulations, clinical guidelines, terminology, drug names and drug dosages), and is not responsible for any error and/or omissions arising from translation and adaptation or otherwise.