Article Text

Abstract
Background The OXEL study (NCT03487666) was a phase II trial of patients with triple negative breast cancer (TNBC) with residual disease following neoadjuvant chemotherapy, randomized to receive immunotherapy (anti-programmed cell death protein 1, nivolumab), chemotherapy (capecitabine), or chemoimmunotherapy. We previously reported on the primary endpoint of the OXEL trial, demonstrating that a peripheral immunoscore based on circulating immune cells reflecting immune activation was increased in patients treated with immunotherapy. However, compared with cell-based immune assays, sera assays are more cost-effective, less labor-intensive, and samples easier to obtain. Here, we report on differences in serum analytes between treatment arms and associations with clinical response.
Methods Patients (n=38) were assayed for 97 serum analytes before and after 6 and 12 weeks of therapy. Serum analytes were assessed for changes with therapy, and as predictors of disease recurrence and the duration of invasive disease-free survival (iDFS) in both single analyte analyses and machine learning models.
Results Levels of specific analytes at baseline and changes in levels at early time points on treatment preceding recurrence were associated with eventual development of disease recurrence and/or the duration of iDFS. These associations varied based on the therapy patients received. Immunotherapy led to enrichment in pro-inflammatory analytes following treatment, whereas chemotherapy resulted in overall decreases. Changes seen in patients receiving chemoimmunotherapy more closely resembled those observed in patients receiving immunotherapy alone as opposed to chemotherapy alone. Furthermore, logistic regression and Cox proportional hazard models, developed using machine learning methods, demonstrated that combinations of serum analytes were more predictive of disease recurrence and iDFS duration than analyses of single serum analytes. Notably, the multivariable models that predicted patient outcomes were highly specific to the class of treatment patients received.
Conclusions In patients with TNBC with residual disease after neoadjuvant chemotherapy, treatment with immunotherapy alone or chemoimmunotherapy resulted in enhanced immune activation compared with chemotherapy alone as measured by changes in serum analyte levels. Distinct serum analytes, both at baseline and as changes after therapy, predicted clinical outcomes for patients receiving immunotherapy alone, chemotherapy alone, or chemoimmunotherapy.
Trial registration number NCT03487666.
- Biomarker
- Breast Cancer
- Chemotherapy
- Immunotherapy
Data availability statement
Data are available upon reasonable request.
This is an open access article distributed in accordance with the Creative Commons Attribution Non Commercial (CC BY-NC 4.0) license, which permits others to distribute, remix, adapt, build upon this work non-commercially, and license their derivative works on different terms, provided the original work is properly cited, appropriate credit is given, any changes made indicated, and the use is non-commercial. See http://creativecommons.org/licenses/by-nc/4.0/.
Statistics from Altmetric.com
WHAT IS ALREADY KNOWN ON THIS TOPIC
Tumor biopsies are often used to help guide treatment decisions for patients with solid tumors, but this is a highly invasive approach, may be difficult to obtain, and cannot be easily serially sampled. We previously reported on the results of the OXEL trial, a phase II trial of patients with stage I–III triple-negative breast cancer with residual disease following neoadjuvant chemotherapy, randomized to receive immunotherapy, chemotherapy, or chemoimmunotherapy. We showed that a peripheral immunoscore based on circulating immune cells predicted response to immunotherapy-based regimens but not chemotherapy.
WHAT THIS STUDY ADDS
In this study, we use a non-invasive, high-throughput approach to investigate serum biomarkers of response for patients on the OXEL trial. We show that serum analytes, both at baseline and early on treatment, are predictors of clinical response in both single analyte analyses and in multivariable models in a treatment-specific manner.
HOW THIS STUDY MIGHT AFFECT RESEARCH, PRACTICE OR POLICY
This study provides evidence that serum analyte analyses can be used to determine which patients are most likely to benefit from different adjuvant therapies and builds on what can be learned from tumor biopsies and peripheral immune cell profiling. In addition, changes in distinct serum analytes may help to define the mechanism of action of different therapies.
Introduction
Triple-negative breast cancer (TNBC) is an aggressive breast cancer subtype characterized by lack of expression of estrogen receptor, progesterone receptor, and human epidermal growth factor receptor 2.1 The standard of care treatment for early-stage TNBC is a combination of surgery, chemotherapy, and possible radiation therapy. Patients are often treated with neoadjuvant chemotherapy to shrink the tumor prior to surgical resection. About 40–50% of patients achieve a pathologic complete response following neoadjuvant chemotherapy. These patients experience lower rates of disease recurrence and better survival outcomes compared with patients with residual disease.2–7
Predictive biomarkers approved by the Food and Drug Administration to guide treatment of solid tumors with immunotherapy include tumor programmed death-ligand 1 (PD-L1) expression, microsatellite instability, and tumor mutational burden. These biomarkers are measured in tumor biopsies, which can be highly invasive, making repeat sampling largely unfeasible. Tumor biopsies thus do not reflect dynamic changes in the tumor over time. Furthermore, for many patients with solid tumors, metastatic sites may be difficult or not accessible to biopsy. Blood-based biomarkers offer a more efficient and far less invasive approach and can be serially sampled for ongoing assessment of a patient’s immune system before and during therapy. Peripheral immune cell subset analysis can provide information regarding the phenotype and activation state of immune cells. The information collected from peripheral immune cell assays over multiple time points may help define the immune-modulating action of agents alone or in combination therapies and determine which patients may benefit from immune-mediating agents.
We previously reported on the primary endpoint of the OXEL study (NCT03487666), an open-label randomized phase II trial of patients with TNBC with residual disease after neoadjuvant chemotherapy who were randomized to receive immunotherapy alone (anti-programmed cell death protein 1 (PD-1) nivolumab), chemotherapy alone (capecitabine), or chemoimmunotherapy (nivolumab + capecitabine). The primary endpoint was the change in a peripheral immunoscore from baseline to 6 weeks on treatment, based on frequencies of circulating immune cell subsets reflecting immune activation.8 Patients treated with chemotherapy alone had a decrease in a peripheral immunoscore from baseline to 6 weeks, whereas patients treated with immunotherapy-containing regimens had an increased peripheral immunoscore at 6 weeks. We also showed that a peripheral immunoscore based on frequencies of specific immune cell subsets at baseline associated with disease recurrence and the duration of invasive disease-free survival (iDFS) for patients who received immunotherapy-containing regimens, but not for patients receiving chemotherapy alone.
Like immune cell-based assays, blood samples for serum assays can be easily collected throughout treatment. Investigation of circulating analytes provides further insight into the immune state of patients in a far less labor-intensive manner than flow cytometry-based assays of circulating immune cells. Here, we investigated 97 serum analytes by traditional immunoassays and a high-throughput proximity extension assay among patients enrolled in different arms of the OXEL trial. We determined associations between clinical response and levels of serum analytes at baseline and with changes in serum analytes from baseline to 6 and 12 weeks of treatment. Furthermore, we used machine learning methods to develop models of disease recurrence and the duration of iDFS using multiple serum analytes to predict patient response to different therapies.
Methods
Patients and collection of research samples
The treatment protocol for patients enrolled in the OXEL study (NCT03487666) has been previously reported.8 For serum analyses, research blood was collected in serum separator tubes at baseline and 6 and 12 weeks after the initiation of therapy from 38 patients (n=12 receiving immunotherapy alone, n=12 receiving chemotherapy alone, and n=14 receiving chemoimmunotherapy). Serum was collected following centrifugation and stored at −80°C prior to analysis. The total number of patients in each treatment arm who were previously evaluated for circulating tumor DNA (ctDNA) and peripheral blood mononuclear cell subsets,8 and in the current study for serum analytes, is indicated in online supplemental figure 1 and online supplemental table 1, and was based on availability of research samples. Patients in each arm, included in this study, who developed disease recurrence (R) or did not develop recurrence (no R), along with the serum time points analyzed per patient, are indicated in online supplemental table 2.
Supplemental material
Serum analytes
For quantitative methods, commercially available ELISA assays were performed per the manufacturer’s instructions and included soluble cluster of differentiation (CD) 27 (CD27) and CD40 ligand (CD40L) (Life Technologies, Carlsbad, California, USA), PD-1, PD-L1 and CD73 (Abcam, Cambridge, UK), transforming growth factor beta 1 (TGF-β1) and granzyme B (R&D Systems, Minneapolis, Minnesota, USA). The ratio of CD27 to CD40L was calculated. Interleukin (IL)-8, tumor necrosis factor (TNF)-α, IL-10, IL-12p70, IL-1β, IL-2, IL-6, and interferon-γ were measured by a V-PLEX Meso Scale Discovery (MSD) platform for human samples per the manufacturer’s instructions (Meso Scale Diagnostics, Rockville, Maryland, USA). Serum samples were also analyzed using a high-throughput proximity extension assay, the Olink Target 96 Immuno-Oncology panel for biomarker discovery, per the manufacturer’s instructions (Olink, Watertown, Massachusetts, USA). Olink uses a qualitative method, reporting Normalized Protein eXpression values (NPX), an arbitrary unit in a log2 scale calculated from cycle threshold (Ct) values and data pre-processing, with a higher NPX value corresponding to a higher protein concentration. In total, 108 serum analytes were analyzed, with 97 unique analytes after accounting for overlap between quantitative and qualitative methods. For all serum analytes, values below the limit of detection (LOD) were set to the LOD. Analytes with ≥10% data set to LOD were excluded from the analysis, leaving 85 unique analytes for analysis. PD-1 was only included in baseline analyses due to interactions with nivolumab. All serum analytes measured and included in the final analysis are summarized in online supplemental table 3. There was a high degree of concordance between serum analytes measured by quantitative (ELISA and MSD) and qualitative (Olink) methods, as determined by Spearman’s correlation analysis (online supplemental table 4).
Single analyte statistical analyses
Statistical tests for univariable analysis and Kaplan-Meier curves were implemented using RStudio (Boston, Massachusetts, USA) and graphs were generated in GraphPad Prism (GraphPad Software, La Jolla, California, USA). The percent change from baseline to post-treatment time points was calculated for analytes measured with MSD and ELISA assays, and the log2 fold change (NPX post—NPX pre) was calculated for analytes measured with the Olink assay. Changes in analytes between two time points were assessed for statistical significance using paired Wilcoxon signed-rank tests. Baseline levels and changes in the level of analytes were compared between patients with and without recurrence, and between treatment arms, using Wilcoxon rank-sum tests (Mann-Whitney U test). Associations between individual serum analytes at baseline with iDFS and associations with the change in serum analytes from baseline to 6 weeks with iDFS were assessed by Kaplan-Meier analysis with a log-rank (Mantel-Cox) test using median values of individual serum analytes as the cut-off and by single variable Cox proportional hazard (CPH) regression analysis. For all reported data, if there was a redundant association of the same serum analyte between Olink and quantitative assays (ELISAs and MSD), the Olink values were reported, except for in a supplemental table reporting on changes with treatment, where all changes were reported. In this hypothesis-generating study, p values for analyses of individual serum analytes are two-tailed and calculated without adjustment for multiple testing correction (MTC) to reduce the potential of type II error, and with MTC adjustment to reduce the potential of type I error. P values were adjusted using the Holm-Bonferroni method within functional groups of the serum analytes indicated (online supplemental table 3). Unadjusted and adjusted p values are reported for single analyte analyses, with adjusted p values indicated as p-adj. For analysis of single analytes, unadjusted p values <0.05 were considered trends, while p-adj <0.05 were considered statistically significant.
Development of predictive models
Highly correlated serum analytes (R>0.9 by Spearman’s test) were removed from the data set prior to all feature selection methods to avoid multicollinearity within generated models. Serum analyte values were scaled using z-score transformation.
Feature selection and model evaluation: recurrence
To identify the most important serum analytes (ie, features) to predict recurrence, recursive feature elimination (RFE) and forward direction sequential feature selection (SFS) were performed in Python using the scikit-learn9 and mlxtend packages,10 with logistic regression as the classifier. Model performance was evaluated by stratified threefold cross-validation. The data set was split into three parts, leaving one as the validation set. This process was repeated 10 times using scikit-learn.9 Accuracy was calculated based on a 0.5 probability cut-off. All of the chosen 2 and 3 feature models had a median accuracy score of >0.7. The discriminative power of the model was evaluated by area under the receiver operating characteristic curve (AUC). Probability of recurrence and the p values and odds ratios (ORs) of analytes were calculated from logistic regression models of the 1, 2, and 3 most important features. The Wilcoxon rank-sum test (Mann-Whitney U test) was used to evaluate whether the predicted probability of recurrence was significantly different between patients who recurred versus patients who did not recur.
Feature selection and model evaluation: iDFS
To identify features that are most predictive of the duration of iDFS, RFE and Least Absolute Shrinkage and Selection Operator (LASSO) regression were performed based on CPH. The most important 1, 2, and 3 features were selected by RFE, and the most important features were selected by LASSO according to the optimal lambda cut-off with minimum mean cross-validation error. To evaluate the accuracy of generated models and avoid overfitting, threefold cross-validation was implemented, and data were randomly split into training and validation sets. All of the chosen LASSO or 2 or 3 feature RFE models had a median concordance index (C-index) >0.7 across 10 iterations of cross validation. LASSO analysis was performed with the glmnet package11 in R. The survival12 and survminer13 packages were used to calculate the log-rank statistic and to plot Kaplan-Meier curves.
Associations with previously reported ctDNA and the peripheral immunoscore
Using all baseline values, Spearman’s correlation was performed with both single analyte serum levels and the predicted recurrence from models against the previously reported peripheral immunoscore predicting recurrence and iDFS, which was based on frequencies of peripheral immune cell subsets at baseline. A Mann-Whitney U test was performed to assess associations between the presence or absence of ctDNA at baseline with both single serum analyte levels and multivariable serum models that predict recurrence and iDFS. The peripheral immunoscore and presence of ctDNA were determined using methods previously described.8
Results
Baseline serum analytes associate with the development of disease recurrence
The relationship between levels of individual serum analytes at baseline with disease recurrence was assessed for patients enrolled in the OXEL trial in each arm separately, and in a combined analysis of patients who received any immunotherapy-containing regimen (immunotherapy alone or chemoimmunotherapy). In patients treated with immunotherapy alone, trends of higher levels of angiogenesis-stimulating placental growth factor (PGF) (p=0.0411), purine enzyme adenosine deaminase (ADA) (p=0.0260), and checkpoint proteins lymphocyte activation gene 3 (LAG3) (p=0.0411) and PD-L1 (p=0.0411) associated with the eventual development of disease recurrence (figure 1A). Different serum analytes at baseline associated with recurrence for patients treated with chemotherapy alone compared with immunotherapy alone. For patients who received chemotherapy alone, trends of higher levels of neutrophil-recruiting and activating C-X-C motif chemokine ligand (CXCL) 5 (CXCL5) (p=0.0480) and pro-inflammatory cytokine TNF (p=0.0480) were associated with recurrence (figure 1B). In contrast to that seen with immunotherapy alone, lower baseline levels of LAG3 were linked to recurrence in patients receiving chemoimmunotherapy (p=0.0440, figure 1C). In the combined analyses of patients receiving any immunotherapy-containing regimen, a trend of higher baseline levels of lysosomal-associated membrane protein 3 (LAMP3) (p=0.0470) associated with disease recurrence (figure 1D). These associations did not remain significant after multiple testing correction (online supplemental table 5).

Association between baseline levels of individual serum analytes and disease recurrence. Baseline levels of serum analytes were compared in patients who developed recurrence (R) versus those not developing recurrence (no R) for patients treated with immunotherapy alone (A), chemotherapy alone (B), chemoimmunotherapy (C), and immunotherapy alone or chemoimmunotherapy in a combined analysis (D). P values were calculated using the Mann-Whitney U test. Graphs display the median and IQR. *Indicates serum analyte measured by ELISA. ADA, adenosine deaminase; CXCL5, C-X-C motif chemokine ligand 5; LAG3, lymphocyte activation gene 3; LAMP3, lysosomal-associated membrane protein 3; NPX, Normalized Protein eXpression; PD-L1, programmed death-ligand 1; PGF, placental growth factor; TNF, tumor necrosis factor.
Predictive models based on serum analytes at baseline associate with disease recurrence
RFE models were generated with baseline serum analyte levels as predictors to identify the most important analytes predicting disease recurrence. In patients treated with immunotherapy alone, recurrence was predicted by a 1-feature model with higher LAG3 and a 2-feature model also including lower FAS ligand (FASLG), an apoptosis-inducing protein (figure 2A,B). These models predicted significantly different probabilities of disease recurrence between patients who experienced a recurrence and those who did not. The 2-feature model (p=0.0043, figure 2B, AUC=0.972, online supplemental figure 2A,B) had improved predictive utility compared with the 1-feature model (p=0.041, online supplemental table 6A, AUC=0.861, online supplemental figure 2A,B). These models did not predict recurrence in patients receiving chemotherapy alone (online supplemental table 6A), demonstrating their specificity for patients receiving immunotherapy alone. SFS models identified other serum analytes in patients receiving immunotherapy alone, which also did not predict recurrence in patients receiving chemotherapy alone (online supplemental figure 3A–D, online supplemental table 6B).

Predicting disease recurrence using recursive feature elimination in logistic regression models with baseline serum analyte levels. Logistic regression models were generated with levels of serum analytes at baseline by recursive feature elimination for patients treated with immunotherapy alone (A–B), patients treated with chemotherapy alone (C–D), and patients treated with immunotherapy alone or chemoimmunotherapy in a combined analysis (E–F). Forest plots show effect size, confidence intervals, and OR of each analyte included in the models (A, C, E). The predicted probabilities of disease recurrence generated from the models were compared in patients who had an actual recurrence (R) or no recurrence (no R) by Mann-Whitney U test and are displayed for the 1-feature, 2-feature and 3-feature models where applicable (B, D, F). ADGRG1, adhesion G-protein coupled receptor G1; CCL19, chemokine ligand 19; CXCL5, C-X-C motif chemokine ligand 5; FASLG, FAS ligand; LAG3, lymphocyte activation gene 3; MUC-16, mucin-16; OR, odds ratio.
In patients receiving chemotherapy alone, an RFE model identified two serum analytes at baseline, high CXCL5 and high mucin-16 (MUC-16), that predicted statistically higher probability of recurrence in those who recurred compared with those who did not (p=0.018, figure 2C,D, AUC=0.886, online supplemental figure 2C,D). This model did not predict a significant difference in recurrence for patients receiving immunotherapy alone (online supplemental table 6A). MUC-16 also had a direct association with recurrence in a 2-feature SFS model (online supplemental figure 3E–H).
Machine learning-based predictive models of baseline serum analytes were also built in patients who received immunotherapy alone or chemoimmunotherapy in a combined analysis. In these patients, a 2-feature model including high adhesion G-protein coupled receptor G1 (ADGRG1) and low FASLG (p=0.00059, figure 2E,F, AUC=0.889, online supplemental figure 2E,F), along with low chemokine ligand (CCL) 19 (CCL19) in a 3-feature model (p=0.000086, figure 2E,F, AUC=0.917, online supplemental figure 2E,F), predicted a significantly higher probability of disease recurrence in patients who recurred compared with those who did not. The 1-feature model of ADGRG1 alone did not predict significantly different probabilities of disease recurrence (p=0.054, figure 2E,F), demonstrating the potential of improved predictive power of models with multiple serum analytes. None of these models predicted disease recurrence in patients receiving chemotherapy alone (online supplemental table 6A). An SFS model also identified high ADGRG1 contributing to 2-feature and 3-feature models in patients receiving immunotherapy (online supplemental figure 3I–L).
Baseline serum analytes associate with the duration of iDFS
Baseline serum analytes were stratified by median values and examined by Kaplan-Meier analyses to determine associations with the interval of iDFS. Associations with iDFS were also assessed by CPH regression analysis, although Kaplan-Meier analyses revealed stronger relationships.
Higher pre-therapy levels of several of the same analytes that were linked with recurrence (PGF (p=0.0096), ADA (p=0.0096), LAG3 (p=0.05), and PD-L1 (p=0.025) (online supplemental figure 4A)) also had associations with a shorter iDFS in patients receiving immunotherapy alone. Several additional serum analytes at baseline had trending associations with a shorter iDFS, including higher levels of T-cell recruiting cytokine CXCL11 (p=0.05), LAMP3 (p=0.033), and hypoxia regulator carbonic anhydrase IX (CAIX) (p=0.0096) (online supplemental figure 4A). Higher levels of both ADA (p-adj=0.0288) and CAIX (p-adj=0.0348) remained associated with shorter iDFS after adjusting for multiple tests. Corroborating these findings, higher levels of PGF (p=0.020) and CAIX (p=0.046) also associated with a shorter iDFS in these patients by univariate CPH (online supplemental table 7).
In patients who received chemotherapy alone, higher levels of TNF, a feature also linked to recurrence in this cohort, associated with shorter iDFS by univariate CPH analysis (p=0.044, online supplemental table 7); however, no individual serum analytes were identified by the log-rank test.
No associations between serum analytes at baseline and the duration of iDFS were noted in the cohort of patients treated with chemoimmunotherapy, possibly due to the small number of patients with recurrence on this arm (n=2). However, in a combined analysis including patients treated with immunotherapy alone or chemoimmunotherapy, a shorter iDFS had trending associations with higher levels of PD-L1 (p=0.016) and LAMP3 (p=0.020) (online supplemental figure 4B), two analytes also associated with iDFS in patients receiving immunotherapy alone.
Predictive models based on serum analytes at baseline associate with iDFS
The contribution of multiple serum analytes at baseline in predicting iDFS was investigated using two different feature selection methods and CPH-based regression models.
Using RFE, 1-feature and 2-feature CPH models were developed with serum analytes as features predicting iDFS in patients receiving immunotherapy alone. A 2-feature model with higher CAIX levels and lower FASLG, a feature also noted in the model predicting disease recurrence, predicted shorter iDFS (p=0.025, figure 3A,B, online supplemental figure 5A). This model did not associate with iDFS in patients receiving chemotherapy alone (online supplemental table 6C), demonstrating that it is specific to patients receiving immunotherapy. A LASSO-based CPH model, also specific to patients receiving immunotherapy, identified overlapping features that were included in other models of response for patients receiving immunotherapy alone, including high CAIX, low FASLG, and high PGF, along with some unique features that collectively predicted worse iDFS (p=0.00051, figure 3C,D, online supplemental figure 6A,B, online supplemental table 6D).

Predicting iDFS by recursive feature elimination with Cox models and LASSO-based Cox regression using baseline serum analyte levels. Cox proportional hazard models were generated with levels of serum analytes at baseline by recursive feature elimination for patients treated with immunotherapy alone (A–B) and for patients treated with immunotherapy alone or chemoimmunotherapy in a combined analysis (E–F). Forrest plots show effect size, CIs, and HRs of each analyte included as a predictor in 1-feature, 2-feature, and 3-feature models where applicable (A, E). LASSO-based CPH models were generated with levels of serum analytes at baseline for patients treated with immunotherapy alone (C–D). The bar plot shows coefficient values of the remaining features at the specified lambda cut-off (C). The predicted survival probabilities were calculated from these models and patients were stratified by ≥ (high) or < (low) median value to plot Kaplan-Meier curves with the duration of iDFS (B, D, F). For iDFS analyses, a log-rank (Mantel-Cox) test was used, and 95% CIs were determined by the Mantel-Haenszel method and shaded on Kaplan-Meier curves. P values and median time of iDFS for patients in the high and low groups are indicated. CAIX, carbonic anhydrase IX; CCL3, chemokine ligand 3; CD8A, cluster of differentiation 8A; CI, confidence interval; CPH, Cox proportional hazard; FASLG, FAS ligand; HR, hazard ratio; iDFS, invasive disease-free survival; LASSO, Least Absolute Shrinkage and Selection Operator.
An RFE-based CPH model to predict iDFS for patients receiving chemotherapy alone identified MUC-16 and TNF, features also identified in the SFS model predicting recurrence. Higher levels of these serum analytes trended with shorter duration of iDFS in patients treated with chemotherapy alone (p=0.076, online supplemental figure 7A–C) but not in patients treated with immunotherapy alone (online supplemental table 6C). In patients treated with chemotherapy alone, a LASSO-based CPH model also identified high MUC-16 and TNF to predict shorter iDFS (p=0.0043, online supplemental figure 6C–F).
In combined analyses of patients receiving either immunotherapy alone or chemoimmunotherapy, an RFE-based CPH model identified important serum analytes at baseline that were associated with iDFS. In a 3-feature model, high levels of cluster of differentiation 8A (CD8A) and low levels of CCL3 and FASLG predicted shorter iDFS (p=0.0097, figure 3E,F; online supplemental figure 5B,C). This model did not associate with iDFS in patients receiving chemotherapy alone (online supplemental table 6C). A LASSO-based CPH model also showed that low CCL3 and FASLG, along with high ADGRG1, a feature also associated with recurrence in these patients, predicted shorter iDFS (p=0.0097, online supplemental figure 6G–J).
Serum analyte changes after therapy depend on the treatment patients receive
Changes in serum analytes from baseline to 6 and 12 weeks of therapy were assessed in each treatment arm separately (online supplemental table 8). Patients receiving immunotherapy alone or chemoimmunotherapy demonstrated signs of enhanced immune activation, with increases in multiple pro-inflammatory immune-related analytes, compared predominantly with decreases with chemotherapy alone.
Ingenuity Pathway Analysis of serum analytes assessed by Olink’s immuno-oncology panel with significant changes at 6 (figure 4A) and 12 weeks (online supplemental figure 8A,B) demonstrated mainly increases in immune-related pathways for patients treated with immunotherapy alone or chemoimmunotherapy, while decreases were seen with chemotherapy alone. For example, the “Pathogen Induced Cytokine Storm Signaling Pathway” was enhanced at both 6 (figure 4A) and 12 weeks (online supplemental figure 8A,B) for patients receiving immunotherapy alone compared with a decrease at both time points for patients receiving chemotherapy alone. Furthermore, the “Th1 Pathway” was increased at 6 weeks for patients receiving immunotherapy alone, providing further evidence of enhanced T-cell activity (figure 4A).

Serum analytes differentially changing with therapy between treatment arms. Ingenuity Pathway Analysis of analytes measured by the Olink assay that were changed after 6 weeks of therapy compared with baseline (p<0.05 by Wilcoxon signed-rank test) for patients treated with immunotherapy alone (IO), chemotherapy alone (Chemo), or chemoimmunotherapy (Chemo-IO) (A). Pathways with an absolute z-score >1.5 are displayed. Circles indicate the −log10 (p value) and bars indicate z-score (red: upregulated pathway; blue: downregulated pathway). Vertical dashed lines at an absolute z-score >2 highlight pathways with a greater potential for biological relevance. Heatmap displaying the median log2 fold change (Log2FC) at 6 and 12 weeks on treatment compared with baseline of serum analytes that were significantly changed differently between treatment arms, with functional groups indicated (B). Select graphs displaying differences in change of circulating analytes including CXCL9 (C), GZMA (D), and MUC-16 (E) after 6 and 12 weeks of therapy compared with baseline. Differences were calculated between treatment arms as Log2FC. P values were calculated using the Mann-Whitney U test. CXCL9, C-X-C motif chemokine ligand 9; GZMA, granzyme A; MUC-16, mucin-16.
Statistical comparisons were made between treatment arms for changes in levels of serum analytes from baseline to 6 and 12 weeks of treatment. Analytes with significant differences between arms are summarized in figure 4B and online supplemental table 9 and display greater immune activation for patients treated with immunotherapy alone or chemoimmunotherapy compared with chemotherapy alone. For example, greater increases in chemokines such as CXCL9 (figure 4C), granzymes including granzyme A (GZMA) (figure 4D), and tumor-associated surface proteins including MUC-16 (figure 4E), along with various other analytes falling into a range of functional categories, were seen for patients receiving immunotherapy-containing regimens compared with chemotherapy alone.
Early changes in individual serum analytes associate with disease recurrence
Changes in individual serum analytes from baseline to 6 and 12 weeks were compared in patients treated with immunotherapy alone who experienced recurrence versus those who did not. A trending greater increase in natural killer (NK) inhibitory receptor killer cell immunoglobulin-like receptor 3DL1 (KIR3DL1) (p=0.0152) was observed in patients developing disease recurrence after 6 weeks of therapy, with this difference sustained at 12 weeks (p=0.0152, figure 5A, online supplemental figure 9A). Greater increases in MUC-16 (p=0.0087), and trends of greater increases in immunosuppressive soluble ligand CD40L (p=0.0260), and stress-induced self-antigen MHC class 1 chain-related protein (MICA/B) (p=0.0411) were also seen after 12 weeks of immunotherapy in patients who developed recurrence (figure 5A, online supplemental figure 9A). For patients treated with chemotherapy alone, a trending greater increase at 6 weeks in CAIX (p=0.0242) and CCL4 (p=0.0242) associated with recurrence (figure 5A, online supplemental figure 9B). Trending greater increases after 6 weeks of chemoimmunotherapy in the immunosuppressive cytokine IL-10 (p=0.0440), chemokines CCL20 (p=0.0220) and CCL23 (p=0.0440), matrix metalloproteinase (MMP) 12 (MMP12) (p=0.0220), and CD40L (p=0.0440) associated with recurrence (figure 5A, online supplemental figure 9C). In combined analyses of patients receiving immunotherapy alone or chemoimmunotherapy, trending greater increases at 6 weeks in IL-10 (p=0.0470) and MMP12 (p=0.0470) (figure 5A–C), and greater increases at 12 weeks in CD40L (p=0.0036) and MUC-16 (p=0.0107) (figure 5A,D,E), associated with recurrence. After correction for multiple tests, the greater increase after 12 weeks in MUC-16 (p-adj=0.0346) for patients treated with immunotherapy alone and MUC-16 (p-adj=0.0430) and CD40L (p-adj=0.0321) in the combined analysis of immunotherapy alone or chemoimmunotherapy remained significantly different between patients who had a recurrence from those who did not (online supplemental table 5).

Changes in individual serum analytes after therapy associate with disease recurrence. Heatmap displaying the magnitude of change in levels of serum analytes (Log2FC) after 6 and 12 weeks of therapy versus baseline in patients who developed disease recurrence (R) versus those not developing recurrence (no R), for patients treated with immunotherapy alone (IO), chemotherapy alone (Chemo), chemoimmunotherapy (Chemo-IO), and immunotherapy alone or chemoimmunotherapy in a combined analysis. In the heatmap, *indicates a significantly greater increase in the change from baseline to post-time points for patients with R compared with no R. The difference in the change in select serum analytes for individual patients treated with immunotherapy alone or chemoimmunotherapy in a combined analysis with R versus no R after 6 weeks of therapy is displayed for IL-10 (B) and MMP12 (C), and after 12 weeks of therapy for CD40L (D) and MUC-16 (E). P value was calculated using the Mann-Whitney U test. Graphs display the median and IQR. #Indicates serum analyte measured by ELISA. CD40L, cluster of differentiation 40 ligand; IL10, interleukin 10; Log2FC, log2 fold change; MMP12, matrix metalloproteinase 12; MUC-16, mucin-16.
Predictive models based on early changes in serum analytes that associate with the development of disease recurrence
The contribution of early post-treatment changes in multiple serum analytes to predicting disease recurrence was investigated using two feature selection methods and logistic regression.
Early changes in serum analytes at 6 weeks were evaluated as recurrence predictors using RFE with a logistic regression classifier. For patients receiving immunotherapy alone, a greater rate of change in KIR3DL1 and a smaller rate of change in CD4 predicted a statistically higher probability of recurrence in patients who recurred compared with those who did not recur (p=0.026, figure 6A,B, AUC=0.889, online supplemental figure 10A,B). This model did not predict recurrence in patients receiving chemotherapy alone (online supplemental table 6A), highlighting its predictive relevance only for patients receiving immunotherapy alone. An SFS model also identified increased CD4 in a 2-feature model as predicting recurrence (online supplemental figure 11A–D).

Predicting disease recurrence using recursive feature elimination in logistic regression models of early changes in serum analytes after therapy. Logistic regression models were generated with changes in serum analytes at 6 weeks versus baseline by recursive feature elimination for patients treated with immunotherapy alone (A–B), patients treated with chemotherapy alone (C–D), and patients treated with immunotherapy alone or chemoimmunotherapy in a combined analysis (E–F). Forest plots show effect size, confidence intervals, and ORs of each analyte included in the models (A, C, E). The predicted probabilities of recurrence generated from the models were compared in patients who had actual disease recurrence (R) or no recurrence (no R) by Mann-Whitney U test and are displayed for the 2-feature and 3-feature models (B, D, F). CAIX, carbonic anhydrase IX; CD4, cluster of differentiation 4; CXCL5, C-X-C motif chemokine ligand 5; IL10, interleukin 10; IL12RB1, interleukin 12 receptor, beta subunit 1; KIR3DL1, killer cell immunoglobulin-like reception 3DL1; OR, odds ratio.
In patients treated with chemotherapy alone, a 2-feature RFE model was generated where a greater rate of change of CAIX and a smaller rate of change of interleukin 12 receptor, beta subunit 1 (IL12RB1), associated with recurrence (p=0.0061, figure 6C,D, AUC=1.000, online supplemental figure 10C,D). This model did not separate patients by recurrence when applied to patients treated with immunotherapy alone (online supplemental table 6A). A 2-feature SFS model for recurrence included increased CCL4 and decreased arginase 1 (ARG1) (online supplemental figure 11E–H).
In combined analyses of patients receiving immunotherapy alone or chemoimmunotherapy, 2-feature and 3-feature logistic regression models based on changes in serum analyte levels after 6 weeks of therapy predicted recurrence. The 2-feature model with a greater increase of IL-10 and a slower increase of CD4 predicted a statistically higher probability of recurrence in patients who recurred (p=0.0027, figure 6E,F, AUC=0.792, online supplemental figure 10E,F). Inclusion of the neutrophil-recruiting chemokine CXCL5 in a 3-feature model further separated patients by predicted probabilities of recurrence (p=0.00044, figure 6E,F, AUC=0.854, online supplemental figure 10E,F), where an increase in CXCL5 associated with recurrence. These models did not show a statistical difference in predicted recurrence when applied to patients receiving chemotherapy alone (online supplemental table 6A), highlighting the selective utility of this model. In a combined analysis of patients receiving immunotherapy alone or chemoimmunotherapy, SFS models also identified that increases in MUC-16 and IL-10 predicted a higher probability of recurrence in 2-feature and 3-feature models (online supplemental figure 11I–L). These models did not predict recurrence when applied to patients receiving chemotherapy alone (online supplemental table 6B).
Analyses of patients treated with immunotherapy alone and in combined analyses of either immunotherapy regimen identified shared features that were associated with recurrence, including high LAG3 and low FASLG at baseline and increased IL-10 and decreased CD4 at 6 weeks. Only MUC-16 at baseline was identified as associating with recurrence in patients treated with chemotherapy alone and immunotherapy alone, but the association with recurrence was in opposite directions.
Early changes in individual serum analytes associate with the duration of iDFS
For patients treated with immunotherapy alone, a trend of a greater increase after 6 weeks in KIR3DL1 (p=0.025) and ARG1 (p=0.025) associated with shorter iDFS, while a greater increase in soluble CD4 associated with longer iDFS (p=0.0096), which remained significant after correcting for multiple tests (p-adj=0.0288) (online supplemental figure 12A). A greater increase in KIR3DL1 also associated with shorter iDFS by single-variable CPH analysis in patients receiving immunotherapy alone (p=0.019, online supplemental table 7). For patients treated with chemotherapy alone, greater increases in CAIX (p=0.031) and CCL4 (p=0.031) at 6 weeks were linked to worse iDFS by both log-rank test (online supplemental figure 12B) and single-variable CPH analysis (p=0.027 and p=0.050, respectively) (online supplemental table 7). For patients treated with chemoimmunotherapy, no changes in serum analytes from baseline to 6 weeks associated with the duration of iDFS. However, in combined analyses of patients treated with immunotherapy alone or chemoimmunotherapy, a greater increase in MMP12 at 6 weeks was associated with a shorter iDFS (p=0.011) and remained significant after MTC (p-adj=0.033, online supplemental figure 12C).
Predictive models based on early changes in serum analytes that associate with the development of duration of iDFS
The contribution of early changes at 6 weeks post-treatment in multiple serum analytes in predicting iDFS was investigated using two different selection methods and CPH models.
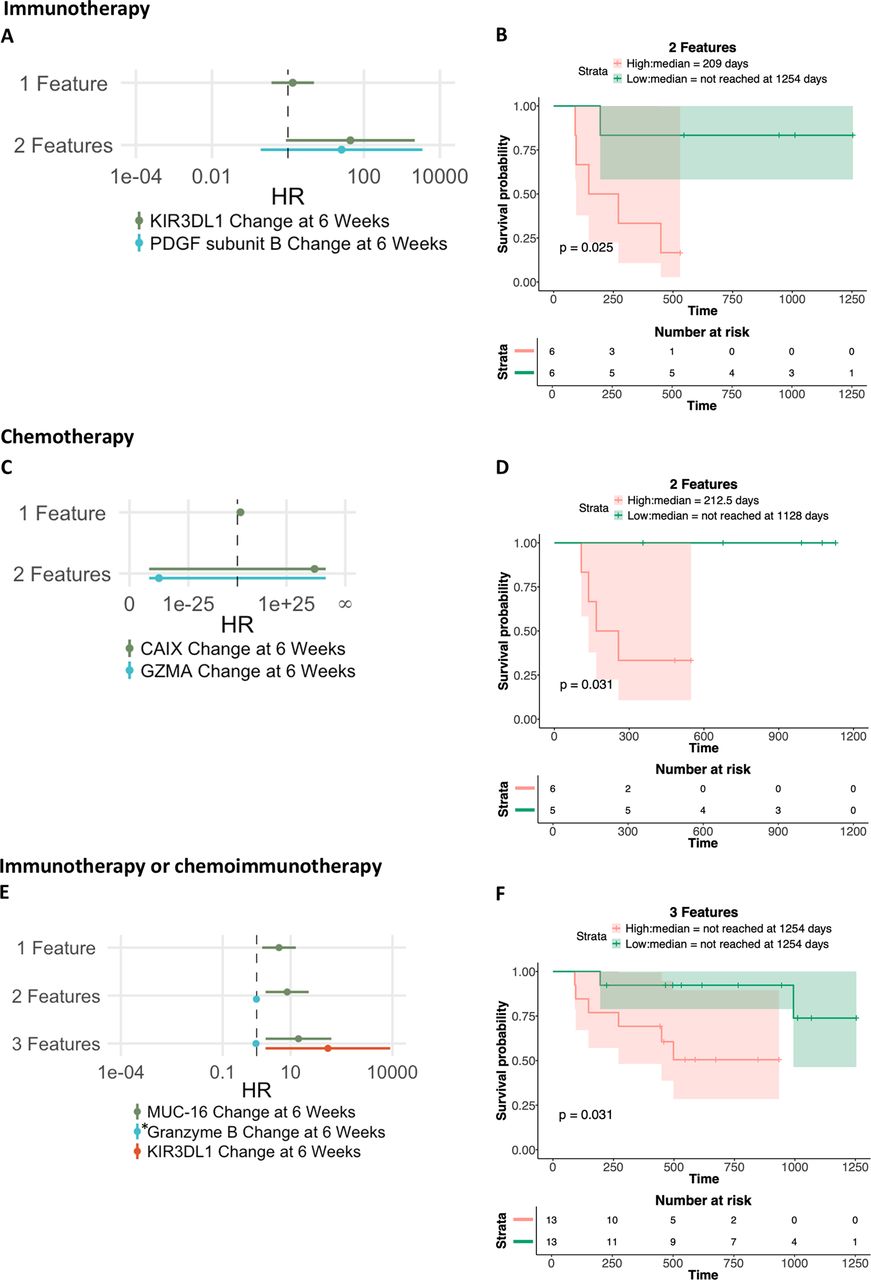
An RFE-based CPH 2-feature model identified increased KIR3DL1 and angiogenesis-promoting platelet-derived growth factor (PDGF) as predicting shorter iDFS in patients receiving immunotherapy alone (p=0.025, figure 7A,B, online supplemental figure 13A), but not in patients receiving chemotherapy alone (online supplemental table 6C). For patients receiving immunotherapy alone, a LASSO-based CPH model identified increased KIR3DL1 and PDGF, overlapping features with models associated with response, along with other features, that collectively predicted shorter iDFS in patients receiving immunotherapy alone (p=0.025, online supplemental figure 14A–D).

Predicting iDFS using recursive feature elimination with Cox models using early changes in serum analytes. Cox proportional hazard models were generated from changes in serum analytes at 6 weeks versus baseline by recursive feature elimination for patients treated with immunotherapy alone (A–B), patients treated with chemotherapy alone (C–D), and patients treated with immunotherapy alone or chemoimmunotherapy in a combined analysis (E–F). Forest plots show effect size, CIs, and HRs of each analyte included as a predictor in 1-feature, 2-feature, and 3-feature models, where applicable (A, C, E). The predicted survival probabilities were calculated from these models and patients were stratified by ≥ (high) or < (low) median change values to plot Kaplan-Meier curves with the duration of invasive disease-free survival (iDFS) (B, D, F). For iDFS analyses, a log-rank (Mantel-Cox) test was used, and 95% CIs were determined by the Mantel-Haenszel method and shaded on Kaplan-Meier curves. P values and median time of iDFS for patients in the high and low groups are indicated. *Indicates serum analyte measured by ELISA. CAIX, carbonic anhydrase IX; CI, confidence interval; GZMA, granzyme A; HR, hazard ratio; KIR3DL1, killer cell immunoglobulin-like receptor 3DL1; MUC-16, mucin-16; PDGF, platelet-derived growth factor.
A higher rate of change in CAIX and a slower rate of change in GZMA after 6 weeks of chemotherapy alone predicted shorter iDFS (p=0.031, figure 7C,D, online supplemental figure 13B). This model, however, did not apply in patients treated with immunotherapy alone (online supplemental table 6C). For patients receiving chemotherapy alone, a LASSO-based CPH model identified that a higher rate of change in CAIX and CCL4 and a smaller rate of change in GZMA and IL-12RB1 predicted shorter iDFS (p=0.031, online supplemental figure 14E–H).
Early changes in serum analytes also predicted iDFS in patients receiving immunotherapy alone or chemoimmunotherapy in a combined analysis (figure 7E,F, online supplemental figure 13C,D). A 3-feature model consisting of greater increases in MUC-16 and KIR3DL1 and a slower rate of change in granzyme B predicted shorter iDFS (p=0.031, figure 7F). This model did not associate with iDFS in patients receiving chemotherapy alone (online supplemental table 6C).
In combined analyses of patients who were treated with immunotherapy alone or chemoimmunotherapy, a LASSO-based CPH model identified all features that were seen in other models from this cohort. Features predicting worse iDFS in this model included greater increases in MUC-16, IL-10, KIR3DL1, CXCL5, and slower rates of change in soluble CD4 and granzyme B (p=0.019, online supplemental figure 14I–L). This model did not associate with iDFS in patients receiving chemotherapy alone (online supplemental table 6D).
Shared analytes that were associated with shorter iDFS were identified in analyses of patients treated with immunotherapy alone and in combined analyses of patients receiving either immunotherapy regimen. These include high FASLG at baseline, a smaller change in CD4 at 6 weeks, and a greater change in KIR3DL1 and MUC-16 at 6 weeks. Only high CD8A at baseline was identified as associating with iDFS in patients treated with chemotherapy alone and the combined analysis of any immunotherapy-containing regimens, but the effect was small in those who received chemotherapy alone.
Associations of serum analytes with ctDNA and the peripheral immunoscore
We evaluated correlations between the previously reported peripheral immunoscore and baseline levels of serum analytes (online supplemental table 10A). As previously reported, a higher peripheral immunoscore at baseline was associated with no recurrence and shorter iDFS for patients treated with immunotherapy alone and in the combined analysis of any immunotherapy-containing regimen.8 For patients treated with immunotherapy alone, there was a positive association between serum levels of FASLG and the peripheral immunoscore (Spearman’s R=0.7116, p=0.0117, p-adj=0.0468, online supplemental figure 15A, online supplemental table 10A). This is notable as lower levels of FASLG contributed to recurrence and shorter iDFS in predictive models at baseline. Peripheral immunoscores were also negatively correlated with predicted probabilities of recurrence from the RFE model (Spearman’s R=−0.73, p=0.008, online supplemental figure 15B, online supplemental table 10B), iDFS risk score from the RFE model (Spearman’s R=−0.65, p=0.021), and iDFS risk score from the LASSO model (Spearman’s R=−0.7, p=0.011) (online supplemental figure 15B, online supplemental table 10B). No correlations were found between the peripheral immunoscore and predictions of patient outcome from models in patients treated with chemotherapy alone or in the combined analysis of patients who received immunotherapy alone or chemoimmunotherapy (online supplemental table 10B).
Baseline ctDNA was previously reported as a strong predictor of recurrence and worse iDFS for patients on all treatment arms combined. Several associations were made between baseline ctDNA and serum analyte levels at baseline in each of the treatment arms (online supplemental table 11A). In addition, some of the predictions from the models associated with baseline ctDNA, including a shorter predicted duration of iDFS by the RFE model of serum analytes at baseline in patients with ctDNA who received any immunotherapy-containing regimen (p=0.047, online supplemental table 11B).
We also performed analyses to determine whether incorporation of the peripheral immunoscore or presence of ctDNA prior to therapy as additional features could improve the multivariable models based on levels of serum analytes at baseline. Notably, the incorporation of the peripheral immunoscore or the presence of ctDNA, both of which are measures obtained through more labor-intensive methods than serum analyses, did not markedly improve the prediction of recurrence or time to iDFS beyond that seen with models based on serum analytes alone (online supplemental table 12).
Discussion
In this retrospective analysis of patients from the OXEL trial, we investigated serum analytes, both at baseline and as changes on treatment, for therapy-specific changes and associations with clinical response. Treatment with immunotherapy resulted in enrichment of pro-inflammatory analytes with evidence of enhanced T-cell activity, whereas chemotherapy led to decreases. Changes in patients receiving chemoimmunotherapy more closely resembled changes in patients receiving immunotherapy alone compared with chemotherapy alone. Furthermore, combinations of multiple serum analytes in logistic regression and CPH models improved the prediction of patient outcomes compared with single analyte analyses. Notably, both the single analyte analyses and machine learning-based predictive models were highly specific to the class of treatment patients received. It should be noted that the current machine learning-based predictive models developed in this study are preliminary and hypothesis generating. Further exploration of these models in larger independent cohorts will be needed to determine their validity and is planned for when such data are available.
While the single analyte analysis revealed interesting findings that may invite further exploration, our data suggest that predictive models of recurrence and iDFS comprising multiple soluble analytes provide stronger predictive ability. One of the best-performing models in the current study was a 3-feature RFE model combining higher levels of ADGRG1 and lower levels of FASLG and CCL19 at baseline to predict recurrence in the combined analysis of patients treated with an immunotherapy regimen. ADGRG1 is an adhesion G protein-coupled receptor that is enhanced in several cancer types, and promotes migration, epithelial-mesenchymal transition and proliferation of cancer cells (reviewed in ref14). Higher messenger RNA levels of ADGRG1 in tumors correlate with poor survival in patients with breast cancer.15 Secretion of ADGRG1 from tumor cell lines in vitro has been reported.16 The second feature, FASLG, is expressed on activated T and NK cells and binds FAS receptor to induce apoptosis. Soluble FASLG can be produced by MMP cleavage,17 and has been shown to reduce immune suppression18–20 and induce apoptosis of cancer cells.21 Higher serum FASLG was associated with both increased cytotoxic T-cell infiltration and reduced recurrence in patients with chemotherapy-treated ovarian cancer.22 There are no prior reports on its association with outcomes for patients treated with immunotherapy. The third feature, CCL19, binds CCR7 and attracts dendritic cells and T cells. CCL19 expression in the tumor microenvironment of patients with breast and ovarian cancer associates with improved outcomes and CD8+ T cell infiltration.23 In patients with follicular lymphoma treated with chemoimmunotherapy, higher CCL19 serum levels were associated with longer progression-free survival.24 Our findings demonstrate that the predictive performance of this model, and others described in our study, improves with the addition of each feature.
Several feature selection methods identified overlapping features, and some of these overlapping features were associated with both disease recurrence and a shorter iDFS. For example, in analyses of patients who received either immunotherapy alone, and in combined analyses of patients who received any immunotherapy-containing regimen, models containing lower baseline levels of FASLG were predictive of both recurrence and shorter iDFS. It should also be noted that most of the overlapping changes in serum analytes were between patients treated with immunotherapy alone and chemoimmunotherapy, and not between patients who received chemotherapy alone and an immunotherapy-containing regimen, highlighting the treatment dependence of the predictive models.
Other studies have demonstrated an association between levels of circulating analytes with response to immunotherapy. For example, high baseline levels of circulating cytokines IL-6,25–31 IL-10,32 33 and IL-8,29 31 33 34 soluble immune checkpoint proteins PD-L1, PD-1, CTLA-4, and LAG3 (reviewed in ref,35) and increases after treatment in specific serum cytokines (eg, IL-6, IL-8) and soluble factors associate with worse outcomes for patients with cancer.31 35–37 Alternatively, higher levels of granzyme B at baseline associate with improved outcomes to immune checkpoint inhibitors.38
A limited number of studies have previously reported on multivariable models of serum or plasma soluble factors to predict outcomes to immunotherapy. In patients with HPV-associated cancers, a model consisting of baseline TGF-β, IL-8, and neutrophil-to-lymphocyte ratio associated with clinical outcome following treatment with an immunotherapy agent targeting PD-L1 and TGF-β.39 A model consisting of cytokeratin 19 fragment and carcinoembryonic antigen predicted non-response in patients with non-small cell lung cancer (NSCLC) treated with immunotherapy.40 Also in patients with NSCLC, a model built with multiple plasma analytes predicted improved benefit to immune checkpoint inhibitors, improving on tumor PD-L1 expression as the sole predictive biomarker for response.41 Additionally, in patients with TNBC, higher baseline levels of five soluble tumor markers predicted higher rates of recurrence by a LASSO CPH model.42
It should be noted that we have built our models in this study based on serum analytes, although plasma is also often used to measure soluble factors. A limited number of studies have evaluated the prognostic value of matched serum and plasma analytes in patients with cancer. A report on the prognostic value of vascular endothelial growth factor (VEGF) in patients with colorectal carcinoma revealed differences in measurements from matched serum and plasma, with preoperative serum VEGF being a better indicator of overall survival compared with plasma.43 However, an analysis of 51 cytokines and soluble factors by various immunoassays demonstrated that many cytokines display a high level of concordance between serum and plasma, with some spread observed among less abundant factors.44 Therefore, models built on plasma analytes may in some cases be similar to serum, but in others may yield different results, and the source material may not be interchangeable.
We previously reported on peripheral immunoscores predictive of immune activation and patient outcomes in the OXEL trial, based on combined peripheral immune cell subset frequencies.8 In addition, ctDNA was a strong predictor of iDFS in all arms combined. Despite the considerable impact of these previous findings, peripheral immune cell phenotyping and identification of ctDNA are both labor-intensive methods. Measurement of ctDNA especially presents several challenges, including access to tumor biopsies, the need for sequencing to identify tumor-specific mutations for each patient, and a short half-life of ctDNA requiring rapid sample processing. Serum analyte analysis is a more efficient and cost-effective method compared with both ctDNA measurement and flow-based assays to evaluate circulating immune cells. Serum analyte analysis can provide information regarding the baseline immune status and dynamic changes in patients’ immune response during treatment. In addition, the Olink platform allows for high-throughput analysis of soluble analytes from less than 10 µL of serum or plasma, which is beneficial when sample volumes are limited. We show that several of our predictive models, built on serum analytes using machine learning, correlate with the previously reported peripheral immunoscore and are associated with the presence of ctDNA, further reinforcing the value of serum analytes as a less labor-intensive alternative to other methods.
Conclusion
These findings demonstrate that patients enrolled in the OXEL trial exhibit notable differences in serum analytes both at baseline and during treatment that associate with clinical response, depending on whether patients receive immunotherapy alone, chemotherapy alone, or chemoimmunotherapy. These serum analytes can be readily measured, offering a more efficient method than immune cell profiling or ctDNA quantification. The variations in serum profiles at baseline and early on treatment, which associate with recurrence and iDFS, suggest future potential for more targeted therapies to improve efficacy. Furthermore, the combination of serum analytes in multivariable models improves on the prediction of both disease recurrence and the duration of iDFS. The treatment specificity of predictive models may further inform on which therapies will be most likely to benefit patients.
Data availability statement
Data are available upon reasonable request.
Ethics statements
Patient consent for publication
Ethics approval
This study complied with all relevant ethical regulations and was approved by the MedStar Georgetown University Hospital Institutional Review Board. Participants gave informed consent to participate in the study before taking part.
Acknowledgments
We would like to express our gratitude to the patients and study investigators who participated in the original trial. We thank Debra Weingarten for her assistance in the preparation of this paper.
References
Footnotes
X @FLynce
NJT and MTL contributed equally.
Contributors NJT, MTL, FL, JS, RND conceived and designed the study. FL, CM, CI provided patient care and provision of study materials. NJT, MTL, FL, CM, CI, JS, RND collected and/or assembled data. NJT, MTL, JS, RND analyzed and interpreted the data. NJT, MTL, JS, RND wrote the manuscript. All authors reviewed and approved the final manuscript. JS is the guarantor.
Funding This research was supported by the Intramural Research Program of the Center for Cancer Research, National Cancer Institute (NCI), National Institutes of Health (NIH).
Competing interests FL reports consulting for AstraZeneca, Pfizer, Eli-Lilly, Daiichi Sankyo; and institutional research funding from Merck, AstraZeneca, Zentalis, Ideaya, and Gilead. CI reports consultancies for AstraZeneca, Genentech, Gilead, ION, Merck, Medscape, MJH Holdings, Novartis, Pfizer, PUMA, and Seagen; Royalties from Wolters Kluwer (up-to-date) and McGraw Hill (Goodman and Gillman); and institutional research support from Tesaro/GSK, Seattle Genetics, Pfizer, AstraZeneca, BMS, Genentech, Novartis, and Regeneron. All other authors declare no competing interests.
Provenance and peer review Not commissioned; externally peer reviewed.
Supplemental material This content has been supplied by the author(s). It has not been vetted by BMJ Publishing Group Limited (BMJ) and may not have been peer-reviewed. Any opinions or recommendations discussed are solely those of the author(s) and are not endorsed by BMJ. BMJ disclaims all liability and responsibility arising from any reliance placed on the content. Where the content includes any translated material, BMJ does not warrant the accuracy and reliability of the translations (including but not limited to local regulations, clinical guidelines, terminology, drug names and drug dosages), and is not responsible for any error and/or omissions arising from translation and adaptation or otherwise.