Article Text

Abstract
Background Triple-negative breast cancer (TNBC) is a molecular subtype of breast cancer with high aggressiveness and poor prognosis. Cancer-associated fibroblasts (CAFs) are major components of the TNBC microenvironment and play an important role in tumor progression and treatment responses. Our goal is to identify specific CAFs subpopulations contributing to TNBC development.
Methods Multiomics analyses were applied to identify the CAFs-specific genes related to immunotherapy response. The clinical significance of a CAFs subset with A-kinase anchoring protein 12 (AKAP12) positive was explored in 80 patients with TNBC through double-labeling immunofluorescence assay. Cytometry by time-of-flight and RNA sequencing were performed to elucidate the immune landscape of TNBC microenvironment and functional mechanism of AKAP12+ CAFs.
Results Multiomics analyses identified an AKAP12+ CAFs subset associated with the immunotherapy response of TNBC, and a high population of these cells is correlated with poor prognosis in patients with TNBC. Intratumoral AKAP12+ CAFs promote formation of an immunosuppressive tumor microenvironment by spatially mediating macrophage M2 polarization via interleukin-34 (IL-34)/macrophage-colony stimulating factor receptor (CSF1R) signaling in TNBC. Single-cell RNA sequencing analyses revealed that AKAP12+ fibroblasts interact with macrophages through the PI3K/AKT/IL-34 axis. In addition, pharmacological blockade of the IL-34/CSF1R signaling enhances the efficacy of anti-programmed cell death protein-1 antibody in TNBC rodent models.
Conclusions AKAP12 is mainly expressed in fibroblasts in TNBC. AKAP12+ CAFs population is negatively associated with the prognosis of patients with TNBC. AKAP12+ CAFs shape the immunosuppressive TNBC microenvironment by releasing IL-34 to promote macrophage M2 polarization. Targeting IL-34 may boost the immunotherapeutic efficacy for TNBC.
- Biomarker
- Breast Cancer
- Immunotherapy
Data availability statement
All data relevant to the study are included in the article or uploaded as supplementary information. The data of The Cancer Genome Atlas Breast Invasive Carcinoma Collection and METABRIC cohorts are obtained from the UCSC Xena website (https://xenabrowser.net/datapages/) and the cBioPortal website (https://www.cbioportal.org/), respectively. The single-cell sequencing data of the patient with triple-negative breast cancer cohort receiving anti-programmed cell death protein-1 treatment are downloaded from the website http://biokey.lambrechtslab.org. The spatial transcriptomics data are available from series GSE210616 in the GEO website (https://www.ncbi.nlm.nih.gov/geo/). Other data analyzed in this study are included in the article and supplementary materials.
This is an open access article distributed in accordance with the Creative Commons Attribution Non Commercial (CC BY-NC 4.0) license, which permits others to distribute, remix, adapt, build upon this work non-commercially, and license their derivative works on different terms, provided the original work is properly cited, appropriate credit is given, any changes made indicated, and the use is non-commercial. See http://creativecommons.org/licenses/by-nc/4.0/.
Statistics from Altmetric.com
WHAT IS ALREADY KNOWN ON THIS TOPIC
Triple-negative breast cancer (TNBC) has a low response to current immunotherapy and therefore there is an urgent need for effective combination therapy strategies and predictive biomarkers. Cancer-associated fibroblasts (CAFs) influences tumor immune landscape, treatment response and disease prognosis in TNBC through communicating with cancer cells and infiltrating immune cells. However, key subgroups of CAFs and effective biomarkers as prognostic and response predictors for TNBC individualized treatments are still explorable.
WHAT THIS STUDY ADDS
In this study, we identified a subpopulation of A-kinase anchoring protein 12+ (AKAP12+) CAFs that correlates with immunotherapy response and disease prognosis in TNBC. AKAP12+ CAFs spatially mediate macrophage M2 polarization through the interleukin-34 (IL-34)/macrophage-colony stimulating factor receptor signaling pathway, which promotes the formation of an immunosuppressive tumor microenvironment. In vivo experiments revealed that targeting IL-34 enhanced the efficacy of anti-programmed cell death protein-1 antibody in TNBC.
HOW THIS STUDY MIGHT AFFECT RESEARCH, PRACTICE OR POLICY
Our study identifies AKAP12+ CAFs and their important impact on the TNBC immune microenvironment and immunotherapy response, which contributes to the enhancement of antitumor immunity as well as the promotion of drug development for TNBC.
Background
As the most common cancer and the second leading cause of cancer-associated death among women worldwide, breast cancer has represented a rising global burden in the past four decades.1 Triple-negative breast cancer (TNBC), a molecular subtype of breast cancer, is defined as estrogen receptor (ER) negative and progesterone receptor (PR) negative based on immunohistochemistry (IHC) and human epidermal growth factor receptor 2 (HER2) negative based on IHC and/or fluorescence in situ hybridization, accounting for 15–20% of all breast malignancies.2 Patients with TNBC have inferior clinical outcomes, as shown by the higher recurrence and death rates in contrast to other breast cancer subtypes.3 Chemotherapy remains the cornerstone of breast cancer management, but the 5-year survival rate of metastatic breast cancer is less than 30% even with the optimal chemotherapeutic regimens.4 Although the therapeutic spectrum of breast cancer has expanded beyond chemotherapy due to a deeper insight into the molecular targets contributing to the tumor progression, there is still no clinical application of targeted therapy for patients with TNBC currently.5 Given that TNBC has a high immunogenicity and tumor-infiltrating lymphocytes (TILs), the emerging immunotherapy presents an attractive treatment alternative in this case.6 However, 60–85% of patients with TNBC showed primary immune resistance after immune checkpoint inhibitors (ICIs) monotherapy treatment. Thus, there is an urgent need to identify valuable biomarkers for prognostic prediction and personalized therapy for TNBC.
Enhanced comprehension of cancer cell intrinsic and extrinsic factors involved in the tumor microenvironment (TME) fosters the emergence of innovative prognostic biomarkers and immune-targeted therapies.6 In addition, a growing number of investigations have highlighted the profound impact of non-cancer cells within TME on tumor development and response to therapy.7 Among them, cancer-associated fibroblasts (CAFs) feature prominently in the TME with various origins, phenotypes, and functions. By matrix remodeling, metabolic impacts, and intense signal communications with cancer cells and infiltrating immune cells, CAFs arrange conditions favorable to tumor progression.8 In breast cancer, CAFs increase the aggressiveness of the disease in comparable ways.9 Moreover, a subset of CAFs (CAF-S1) identified using six CAF markers has been found to be enriched in TNBC and exhibited an immunosuppressive role in a T lymphocyte-dependent manner.10 However, consistent exploration of additional CAF subtypes is still demanded for elucidating complicated TME and improving immunotherapeutic efficacy in TNBC.
A-kinase anchoring protein 12 (AKAP12), also called SSeCKS or Gravin, belongs to the AKAP family and functions as a scaffold protein for key signaling mediators such as protein kinase A and C, by which it modulates cell proliferation, migration, and barriergenesis.11 Besides, current studies on various cancers, such as colon, prostate, and breast cancer, have reinforced the concept that AKAP12 is a tumor and metastasis suppressor from the mechanistic perspective.12–15 However, in terms of clinical significance, AKAP12 is positively associated with resistance to anti-vascular endothelial growth factor (VEGF) inhibitors according to a pan-cancer bioinformatic analysis16 and paclitaxel treatment for ovarian cancer,17 which is consistent with the dismal prognoses in those patients. Under the circumstances, an attempt to explain what immunological character AKAP12 may play in the complex microenvironment of TNBC, especially in CAFs and whether it correlates with immunotherapy response in TNBC may help to clarify this paradox.
Here, by employing multiomics analyses, we aim to identify pivotal fibroblast subsets in TNBC and reveal their effects on the immune microenvironment profile and prognosis of TNBC. We found that AKAP12 was mainly expressed in fibroblasts in the TNBC microenvironment using single-cell RNA sequencing (scRNA-seq) analysis. In addition, both high AKAP12 expression and high AKAP12+ fibroblast population were associated with poor immunotherapy response and reduced overall survival (OS) rate in patients with TNBC. Applying cytometry by time-off light (CyTOF) to further study, we found that the TNBC microenvironment with AKAP12+ fibroblast enrichment exhibited an immunosuppressive landscape characterized by a decreased population of antitumor immune cells and an increased population of pro-tumor immune cells, particularly M2 macrophages. Spatial transcriptome (ST) data analysis and in vitro co-culture experiments found that AKAP12+ fibroblast co-localized with CSF1R+ macrophage in TNBC tissues and promoted macrophage M2 polarization through the interleukin-34 (IL-34)-macrophage-colony stimulating factor receptor (CSF1R) signaling axis. In vivo, pharmacological blockade of IL-34 signaling increased the efficacy of anti-programmed cell death protein-1 (PD-1) therapy in TNBC. Collectively, this study reveals the great impact of AKAP12+ fibroblast on the immune microenvironment of TNBC, which facilitates a deeper understanding of heterogeneous immunotherapeutic reactions among patients with TNBC and provides a new direction for drug development.
Methods
scRNA-seq analyses
The single-cell sequencing read count data and corresponding metadata of a TNBC patient cohort receiving anti-PD-1 treatment were downloaded from the website http://biokey.lambrechtslab.org18 and further analyzed using the Seurat package in R software.19 Doublets and cells containing more than 15% mitochondrial counts were removed. After sample normalization, we identified 2,000 highly variable genes and performed principal component analysis using the default parameters of Seurat. The top 20 principal components were applied for Uniform Manifold Approximation and Projection for dimension reduction (UMAP) to cluster cells and distinct cell types were annotated based on the expression of well-known marker genes. Differentially expressed genes (DEGs) were defined using the FindAllMarkers function from Seurat with |log2(FoldChange)| > 1 or 0.5 and p value<0.05 as the criterion. Kyoto Encyclopedia of Genes and Genomes (KEGG) analyses were performed using the clusterProfiler software.
Cell-to-cell communication analysis
The interactions between cells were analyzed using the CellPhoneDB algorithm, which was able to detect the ligand–receptor interactions between cell types in scRNA-seq data.19 The frequency of interactions was displayed using the heatmap_plot function from CellPhoneDB and circlize package (V.0.4.14) in R software. The interaction strength between ligand and receptor was visualized using the dot_plot function and pheatmap package (V.1.0.12).
ST data analysis
The expression data and tissue images for TNBC samples were obtained from the Gene Expression Omnibus (GEO) under record GSE210616.20 The data was processed and visualized using the Seurat package in R software. SPOTlight deconvolution analyses were performed to evaluate the proportions of indicated cell subsets in each captured tissue spot. Briefly, the marker gene matrix of each cell subset in the scRNA-seq data was extracted using the FindAllMarkers function from Seurat with a threshold of log2(FoldChange)>1 and min.pct=0.8. Later, SPOTlight deconvolution was run based on the marker gene matrix and ST data and the results were visualized in the tissue image using the spatial_scatterpie function. The population scores of cell subsets were calculated using SpatialFeaturePlot and further analyzed using Pearson correlation analysis.
Public database analyses
The transcriptomic data and clinical data of The Cancer Genome Atlas Breast Invasive Carcinoma Collection (TCGA-BRCA) and Molecular Taxonomy of Breast Cancer International Consortium (METABRIC) cohorts were obtained from the UCSC Xena website (https://xenabrowser.net/datapages/) and the cBioPortal website (https://www.cbioportal.org/), respectively. A total of 164 patients with TNBC with PAM50 criteria defined as basal or ER, PR, and HER2 status all negative were selected. Bulk RNA sequencing data and clinical information for another cohort of patients with TNBC receiving immunotherapy were downloaded from GEO under record GSE196096.21 DEGs between patients with TNBC receiving pembrolizumab with pathological complete response (pCR) and non-pCR were identified using the DESeq2 package in R software. The proportion of fibroblasts in these samples was estimated using the online EPIC website (https://epic.gfellerlab.org/). The proportions of 22 immune cell types in TCGA and METABRIC cohorts were calculated using the Cell-type Identification By Estimating Relative Subsets Of RNA Transcripts (CIBERSORT) algorithm. The median was used as the threshold to classify the samples into high and low AKAP12 expression or fibroblast population groups, where samples with both high AKAP12 expression and high fibroblasts population were defined as high AKAP12+ fibroblasts population group, and samples with both low AKAP12 expression and low population of fibroblasts were defined as low AKAP12+ fibroblasts population group.
Double-labeling immunofluorescence assay
A human tissue microarray containing a total of 80 TNBC tissues was purchased from Superbiotek (Cat. BRC1601, Shanghai, China). The clinicopathologic details of the patients were shown in online supplemental table S1. Double-labeling immunofluorescence staining was performed on this TNBC tissue microarray using protein-specific antibodies as indicated: Anti-AKAP12 antibody (Cat. M02303, Boster Bio) and anti-α-smooth muscle actin (SMA) antibody (Cat. ab124964, Abcam). The slide was then scanned and analyzed using the CaseViewer software. The population level of AKAP12+ α-SMA+ fibroblasts was estimated as the average number of positive cells in three randomized fields of view under a 40× objective. The median value was used as the threshold to classify patients with TNBC into high and low AKAP12+ α-SMA+ fibroblasts population groups.
Supplemental material
Cytometry by time-of-flight
The CyTOF experiment was performed by PLTTECH (Hangzhou, China) and the specific procedure for CyTOF was as described above.22 Briefly, fresh 4T1 orthotopic TNBC tissues were digested into single-cell suspensions with Liberase/DNAse solution and immune cells were isolated using density gradient centrifugation. Cell suspensions were incubated with anti-mouse CD16/32 monoclonal antibody at room temperature to block Fc receptors, then incubated with a mixture of 39 metal-conjugated antibodies for 30 min on ice and fixed overnight. After cell washing, sample signals were detected using a CyTOF mass cytometer. The data was analyzed using a gating strategy in the FlowJo software. The samples were subjected to bootstrapped clustering using FlowSOM and clusters were annotated manually based on the makers. Detailed antibodies information was showed in online supplemental table S2.
Co-culture assay
For fibroblast extraction, we digested TNBC tissues constructed on AKAP12 knockout (KO) mice or wild-type mice into single-cell suspensions and cultured them in the medium containing 10% fetal bovine serum (FBS) and 100 mg/mL penicillin and streptomycin at 37℃. During incubation, the dishes were gently blown with phosphate-buffered saline (PBS) buffer to remove other cells and after 1–2 weeks, fibroblasts were identified using immunofluorescence assay. AKAP12 KO mouse was purchased from Jicui Yaokang (Nanjing, China) and genotyping was conducted through PCR analysis of genomic DNA derived from mouse tail biopsies. Detailed characterization of the AKAP12 KO mouse strain was performed as previously described.23 CAFs from patient samples were isolated from fresh tumor tissue of patients with TNBC attending the First Affiliated Hospital of Zhengzhou University. We used enzymatic digestion-tissue block culture and differential wall affixation to isolate and purify CAFs,24 and constructed AKAP12-overexpressing CAFs using lentiviral transfection. Bone marrow-derived macrophages (BMDMs) were obtained by extracting mouse bone marrow fluid and maintained with Dulbecco’s Modified Eagle’s Medium containing 50 ng/mL macrophage colony-stimulating factor protein (Cat. 416 ML; R&D Systems). Human monocytic-leukemia cell lines (THP-1) monocytes were induced to differentiate into M0 macrophages using 100 nM PMA (Sigma) for 24 hours. For the co-culture assay, a 24 mm Transwell chamber with 0.4 µm pore polycarbonate membrane (Corning) was employed. Fibroblasts (5×10⁵/well) were seeded in the lower chamber and macrophages (1×10⁶/well) were seeded in the upper chamber for co-cultivation and after 8–12 hours, macrophages were collected for flow cytometry. For rescue experiments, a recombinant mouse IL-34 protein (Cat. 5195 ML; R&D Systems) and human IL-34-neutralizing antibody (Cat. AF5265; R&D Systems) were added to the co-culture system.
Cell lines
The murine TNBC cell lines 4T1 and THP-1 were purchased from the stem cell bank, Chinese Academy of Science (Shanghai, China) and maintained in the Roswell Park Memorial Institute 1640 medium with 10% FBS and 100 mg/mL penicillin and streptomycin at 37℃.
Quantitative real-time PCR
For RNA extraction, cultured fibroblasts were treated with TRIzol reagent (Invitrogen). A PrimeScript RT reagent kit (Takara) was then employed to reverse transcribe RNA into complementary DNA (cDNA) according to the manufacturer’s protocol. After establishing a mixture containing cDNA, primers, and SYBR Green, quantitative real-time PCR (qPCR) was performed on an ABI Prism 7500 Sequence Detection System. The sequences were as follows: Il34: forward: 5’-TTGCTGTAAACAAAGCCCCAT-3’; reverse: 5’-CCGAG
ACAAAGGGTACACATTT-3’; IL34: forward: 5’-CCTGGCTGCGCTATCTTGG-3’; reverse: 5’-AGTGTTTCATGTACTGAAGTCGG-3’. The ∆∆Ct method was used to evaluate the relative IL-34 messenger RNA level with actin as a control.
Western blot assay
Collected fibroblasts were lysed using radio immunoprecipitation assay (RIPA) buffer containing protease inhibitor cocktail. Subsequently, the supernatant of the lysate was mixed with a loading buffer and subjected to thermal denaturation. The protein sample was separated using sodium dodecyl sulfate-polyacrylamide gel electrophoresis (SDS-PAGE) and then combined with a polyvinylidene difluoride (PVDF) membrane. After blocked with 5% skim milk for 1 hour, the membrane was incubated with anti-AKAP12 (Cat. MBS2529546; MyBioSource), anti-AKT (Cat. ab8805; Abcam), anti-phosphorylated AKT (Cat. ab38449; Abcam), or anti-vinculin (Cat. A1758; ABclonal) overnight at 4°C. Finally, after being washed three times with Tris-buffered saline Tween-20 (TBST) buffer and incubated with horseradish peroxidase (HRP)-conjugated secondary antibody for 1 hour at room temperature, the protein bands were exposed to chemiluminescence reagents.
Flow cytometry
Macrophages after co-culturing and tumor tissues harvested from the mouse TNBC model were digested into single-cell suspension. The samples were fixed and permeabilized using a Fixation/Permeabilization Kit (Cat. 554714; BD Biosciences). Later, cells were incubated with Fluorescein Isothiocyanate (FITC) anti-mouse major histocompatibility complex (MHC)-II antibody (Cat. 107606; BioLegend), APC anti-mouse CD206 antibody (Cat. 141708; BioLegend) or APC anti-human CD86 antibody (Cat. 374208; BioLegend) at 4℃ for 30 min. The flow cytometry was performed on a BD FACSAria III flow cytometer and the results were analyzed in the FlowJo software.
ELISA
The quantitative determination of mouse IL-34 concentrations in cell supernatant of fibroblasts was performed using Mouse IL-34 Quantikine ELISA Kit (Cat. M3400; R&D Systems) according to the manufacturer’s instructions.
Animal studies
4T1 cell-derived orthotopic TNBC mouse model was employed for in vivo tumorigenesis assay. Briefly, 100 µL PBS buffer containing 1×10⁵ murine TNBC cell line 4T1 was subcutaneously injected into the mammary fat pads of female Balb/c mice aged 6 weeks. Once palpable (about 100 mm3), mice were randomly divided into four groups (5 mice per group) and injected intraperitoneally with 150 µg neutralizing mouse anti-IL-34 antibody (Cat. AF5195; R&D Systems) three times a week for 2 weeks or/and with two times a week doses of 100 µg mouse anti-PD-1 antibody (Cat. BP0273; Bio X Cell) for 2 weeks. Tumor volume was measured using a vernier caliper once every 3 days and calculated as 0.5×length × width.2 Tumor volume reached 1500 mm3 or day 18 was the endpoint of the experiment. All animal operations were performed in accordance with the guidelines for the care and use of laboratory animals and the study was approved by the Institutional Animal Care and Use Committee of the First Affiliated Hospital of Zhengzhou University (ID: 2021042501).
Statistical analyses
Numerical variables were presented as mean±SD and tested using the Student’s t-test or one-way analysis of variance test as appropriate. Categorical variables were shown as counts (percentage) and compared using the Pearson χ² test or Fisher’s exact test. Survival curves were plotted using the Kaplan-Meier method and analyzed using the log-rank test. Cox regression analyses were conducted in a stepwise manner. Correlation analyses were performed using the Pearson correlation test. All statistical analyses were carried out in SPSS V.22.0 (IBM, Armonk, NY) and R software (V.4.0.0) with a two-tailed p value<0.05 as statistically significant.
Results
Multiomics analyses identify an AKAP12+ fibroblast subset associated with immunotherapy response in patients with TNBC
To identify key transcriptomic features of fibroblasts associated with immunotherapy response in the TNBC microenvironment, we first analyzed the scRNA-seq data from a cohort of 12 patients with TNBC receiving pembrolizumab (anti-PD-1) treatment. The cohort was divided into two groups based on variation in T cell clonotypes: Expansion (E, n=5) and no/limited expansion (NE, n=7), also referred to as therapy responder and non-responder.18 By conducting DEG analyses, we identified 142 upregulated genes and 482 downregulated genes of fibroblasts in the NE group (figure 1A). Those DEGs were cancer-related, with upregulated genes involved in tumor-promoting pathways such as Wnt, PI3K-Akt, and pathways in cancer, while downregulated genes involved in tumor suppression processes such as natural killer cell-mediated cytotoxicity, and tumor necrosis factor signaling pathway, as shown by the KEGG analyses (figure 1B). Meanwhile, we obtained 1170 fibroblast marker genes using clustering analyses. In addition, we analyzed another public data set (GSE196096) containing bulk RNA sequencing data of patients with TNBC receiving immunotherapy and identified 693 upregulated genes in the non-pCR group. To acquire fibroblast-specific genes related to immunotherapy response, we then integrated these three gene lists mentioned above and found that AKAP12 was the only one that was present in all three gene lists (figure 1C). Therefore, we focused on AKAP12 for further studies. UMAP analyses of scRNA-seq data showed that AKAP12 was predominantly expressed in fibroblasts in the TNBC microenvironment (figure 1D,E). In addition, AKAP12 expression level was positively correlated to the fibroblast population in TNBC tissues from the TCGA-BRCA cohort (figure 1F). The double-labeling immunofluorescence staining of 80 patients with TNBC further confirmed the co-localization of AKAP12 and fibroblast-specific marker α-SMA in TNBC tissues (figure 1G). Further investigation on the GSE196096 cohort showed that AKAP12 expression was increased in TNBC tissues with no response to immunotherapy and possessed appealing predictive potential (AUC=0.72, p=0.05) for immunotherapy responses of patients with TNBC with anti-PD-1 treatment combined with chemotherapy compared with chemotherapy alone (figure 1H,I). Besides, the high AKAP12+ fibroblast population group had significantly more non-pCR patients than in the low population group (figure 1J). Similarly, the proportion of cases with both high AKAP12 expression and high fibroblast population was significantly higher in patients with TNBC presenting non-pCR after immunotherapy than in the pCR group (figure 1K).

Multiomics analyses identify a AKAP12+ fibroblast subset associated with immunotherapy response in patients with TNBC. (A) Volcano plot of DEGs of fibroblasts between non-responder and responder groups. (B) KEGG analyses of DEGs mentioned in part A. The upregulated and the downregulated items were shown in red and blue, respectively. (C) Venn diagram of intersected gene in the indicated three gene lists. (D) UMAP plot of cell clusters colored by the expression level of AKAP12 in scRNA-seq data. (E) Violin plot of the AKAP12 expression level in each cell cluster. (F) Pearson correlation analysis of AKAP12 expression level and the population proportion of fibroblast in TNBC tissues from TCGA-BRCA cohort. (G) Representative images of immunofluorescence co-staining of α-SMA (red) and AKAP12 (green) in TNBC tissues. Scale bar, 200 µm (left) and 20 µm (right). (H) AKAP12 expression level among non-pCR and pCR groups in GSE196096. (I) ROC curve presenting the treatment response predictive accuracy of AKAP12 expression level in pembrolizumab and control groups in I-SPY cohort. (J) The number and percentage of patients with non-pCR or pCR after immunotherapy in low and high AKAP12+ fibroblast population groups. (K) Pie chart of different AKAP12 expressions and fibroblast populations in non-pCR and pCR patient groups. AKAP12, A-kinase anchoring protein 12; AUC, area under the curve; DAPI, 4',6-diamidino-2-phenylindole; DEGs, differentially expressed genes; I-SPY, Investigation of Serial Studies to Predict Your Therapeutic Response With Imaging and Molecular Analysis; KEGG, Kyoto Encyclopedia of Genes and Genomes; non-pCR, non-pathologic complete response; pCR, pathologic complete response; pDC, plasmacytoid dendritic cells; ROC, receiver operating characteristic; scRNA-seq, single-cell RNA sequencing; SMA, smooth muscle actin; TCGA-BRCA, The Cancer Genome Atlas Breast Invasive Carcinoma Collection; TNBC, triple-negative breast cancer; TNF, tumor necrosis factor; UMAP, Uniform Manifold Approximation and Projection.
In addition, we compared the differential gene expression between AKAP12+ CAFs and AKAP12− CAFs based on the single-cell transcriptomes and found that the AKAP12+ CAFs expressed high levels of ACTA2, FAP, FN1, and COL1A1, all of which are marker genes for the myofibroblast-like cancer-associated fibroblasts (myCAFs).25–27 Besides, AKAP12+ CAFs have high expressions of TAGLN, POSTN, CTGF, MFAP5, and THY1 and low expressions of IL6, CXCL2, and CXCL8 (online supplemental figure 1A). Therefore, AKAP12+ CAFs may be more associated with myCAF characteristics at the transcriptional level. Besides, we performed immunofluorescence staining CD8 and CD5 and 6 as markers for CD8+ T cells and tumor cells in TNBC patient tissues and found that both AKAP12+ CAFs and CD8+ T cells were predominantly located in the tumor mesenchyme, and there was a potential negative correlation of spatial localization between AKAP12+ CAFs and CK6+ tumor cells (online supplemental figure 1B). We further analyzed the relative localization of CD8+ T cells and tumor cells in reference to AKAP12+ CAFs based on the ST data and found that there was a positive correlation between the spatial distribution of AKAP12+ CAFs and CD8+ T cells (R=0.17) and a significant negative correlation between AKAP12+ CAFs and tumor cells (R=−0.54; online supplemental figure 1C, D). These findings support AKAP12+ fibroblasts as a potential suppressor of an effective antitumor immune response. In conclusion, we identify a subset of AKAP12+ fibroblast in the TNBC microenvironment and unveil a tight relationship between AKAP12+ fibroblast and immunotherapy response in patients with TNBC.
High AKAP12+ fibroblast population is associated with poor prognosis in patients with TNBC
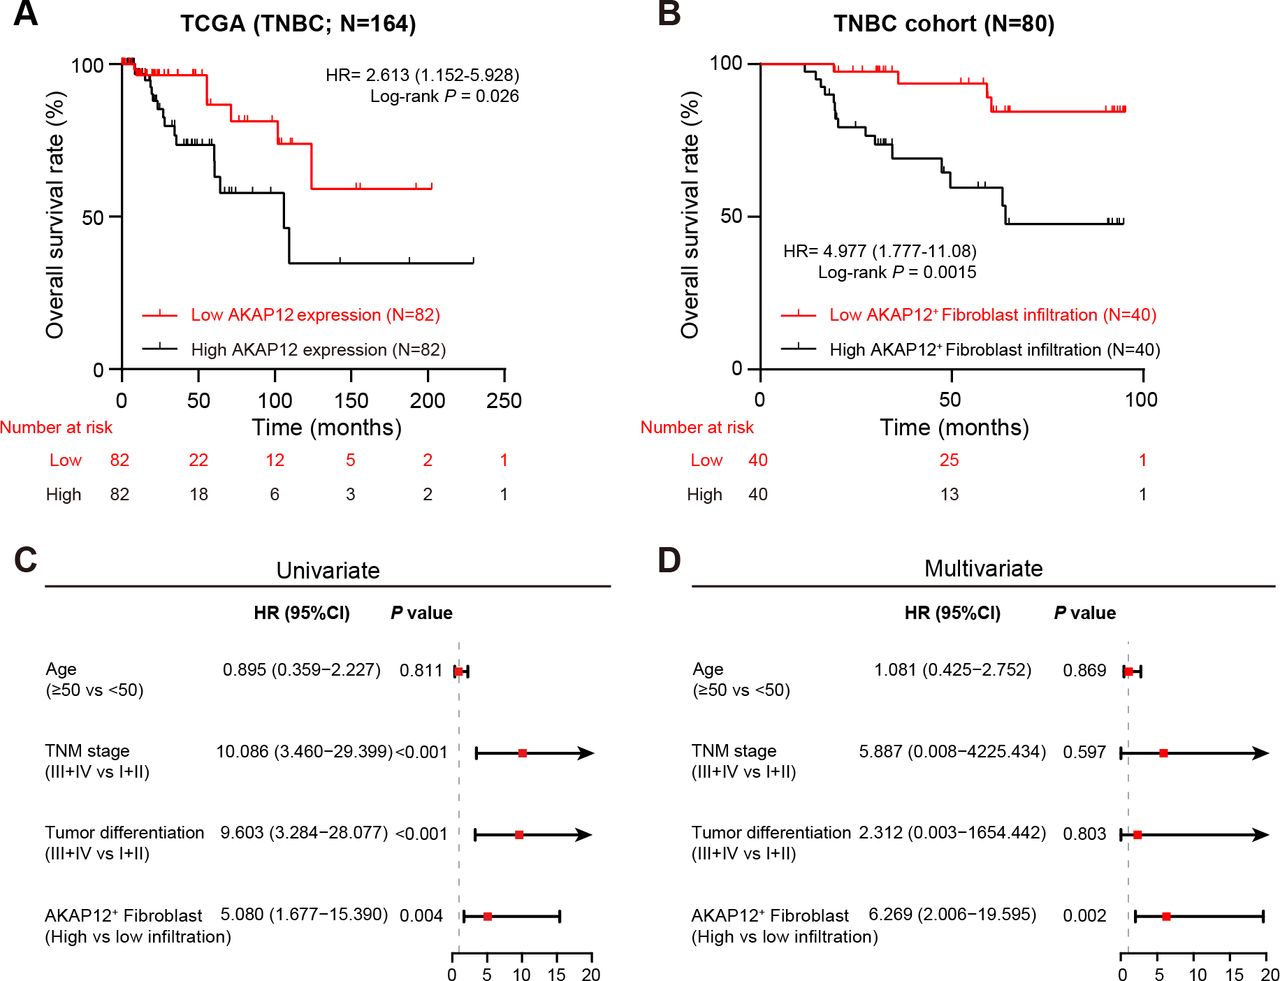
We next investigated the impact of AKAP12+ fibroblast on the prognosis of patients with TNBC. We first applied survival analyses to the TCGA-BRCA cohort and found that patients with TNBC with high AKAP12 expression level experienced worse OS than those with low AKAP12 expression level (p=0.026; figure 2A). In addition, we categorized patients with TNBC from our own cohort into two groups based on the level of AKAP12+ fibroblast population estimated by double-labeling immunofluorescence staining analyses. Similarly, there was a significantly lower OS rate in the high AKAP12+ fibroblast population group compared with that in the low population group (p=0.0015), as illustrated by the Kaplan-Meier survival curve (figure 2B). Moreover, univariate (HR=5.080; 95% CI, 1.677 to 15.350; p=0.004) and multivariate (HR=6.269; 95% CI, 2.006 to 19.595; p=0.002) Cox proportional hazards regression models indicated that high AKAP12+ fibroblast population was an independent prognostic risk factor for OS of our TNBC patient cohort (figure 2C,D). Collectively, an elevated population level of AKAP12+ fibroblast in the TME is significantly associated with a poor prognosis for patients with TNBC, indicating that it is worthy of further investigation beyond its clinical value.

High AKAP12+ fibroblast population is associated with poor prognosis in patients with TNBC. (A) Kaplan-Meier curve for OS of patients with low or high AKAP12 expression in TCGA-BRCA cohort. Log-rank test. (B) Kaplan-Meier curve for OS of patients with low or high AKAP12+ fibroblast population in our TNBC patient cohort. Log-rank test. (C–D) Forest plot depicting univariate and multivariate Cox proportional hazards regression models of OS in patients with TNBC from our own cohort. AKAP12, A-kinase anchoring protein 12; OS, overall survival; TCGA-BRCA, The Cancer Genome Atlas Breast Invasive Carcinoma Collection; TNBC, triple-negative breast cancer; TNM, tumor-node-metastasis.
Intratumoral AKAP12+ fibroblasts correlate with immunosuppressive TNBC microenvironment and mediate macrophage M2 polarization
To elucidate the mechanism underlying the immunotherapy resistance and poor prognosis in patients with TNBC with high AKAP12+ fibroblast population, we first applied CyTOF analyses in 4T1 cell-derived orthotopic TNBC mouse models to map the immune population landscapes and functional status of TNBC tissues with low and high AKAP12+ fibroblast population. Clustering analysis identified 28 cell clusters in the immune microenvironment of the rodent orthotopic TNBC tumors, which were annotated manually into 13 cell types including macrophage, neutrophils, eosinophils, B cell, CD8+ T cell, CD4+ T cell, etc, based on the known markers (figure 3A,B). Then the orthotopic TNBC tumor tissues were classified into two groups according to the population level of AKAP12+ fibroblasts as shown by the immunofluorescence staining images (online supplemental figure 2). Using CyTOF analyses, we surprisingly discovered that the high AKAP12+ fibroblast population group had higher macrophage population levels than the low AKAP12+ fibroblast population group, whereas the other cell types from the two groups were comparable (figure 3C,D). Among the macrophage population, only the C07 subcluster was increased in the high AKAP12+ fibroblast population group compared with the other group, which was featured by the high CD206 expression level, a specific M2 macrophage marker (figure 3E,F). We next focused on the CD206 maker and found a higher expression level in the high AKAP12+ fibroblast population group other than in the low group (figure 3G). Consistently, we also found that the AKAP12+ fibroblast population was positively associated with M2 macrophages, resting CD4 T memory cells, and resting dendritic cells in TCGA-BRCA and METABRIC cohorts using the CIBERSORT algorithm (online supplemental figure 3A, B). Given that M2 macrophages are known for their pro-tumor effects and were closely associated with the high AKAP12+ fibroblast population, we next focused on the crosstalk between these two cell subtypes. In vitro co-culture system and flow cytometry analyses showed that BMDMs co-cultured with AKAP12−/− fibroblasts were predisposed to differentiate into M1 macrophages, as evidenced by the higher MHC-II expression level and lower CD206 membrane expression than those co-cultured with wild type fibroblasts (online supplemental figure 3C; figure 3H,I). Collectively, AKAP12+ fibroblasts are associated with immunosuppressive TNBC microenvironment and promote macrophages M2 polarization.

Intratumoral AKAP12+ fibroblasts correlate with immunosuppressive TNBC microenvironment and mediate macrophage M2 polarization. (A) t-SNE plot of CD45+ cells in the 4T1 cell-derived orthotopic TNBC mouse models based on CyTOF results. Cell cluster was annotated according to the known marker expression. (B) t-SNE plot of CD45+ cells colored by the expression level of marker TCRb, CD4, CD8a, F4_80, Gr1, Ly6C. (C) t-SNE plot of CD45+ cells in the orthotopic TNBC tissue in the low and high AKAP12+ fibroblast population groups. (D) Proportion of the indicated immune cell types in CD45+ cells from the two groups. (E) Heatmap of the 39 markers expressed in each cluster. (F) Proportion of the indicated macrophage subclusters in CD45+ cells from the two groups. (G) Left: t-SNE plot of CD45+ cells colored by the expression level of CD206. Right: CD206 expression level in the two groups. (H–I) Flow cytometry analyses of MHC-II and CD206 expression on BMDMs from the wild type and AKAP12−/− fibroblasts co-culture systems. *p<0.05, **p<0.01, and ***p<0.001, Student’s t-test. AKAP12, A-kinase anchoring protein 12; BMDMs, bone marrow-derived macrophages; cDC, conventional dendritic cell; CyTOF, cytometry by time-off light; DNT, double negative T cell; gdT, gamma-delta T cell; MHC, major histocompatibility complex; NK cell, natural killer cell; NKT, natural killer T cell; pDC, plasmacytoid dendritic cell; TNBC, triple-negative breast cancer; Treg, regulatory T cell; t-SNE, t-distributed stochastic neighbor embedding.
AKAP12+ fibroblasts potentially interact with macrophages via IL-34/CSF1R signaling in TNBC
To identify key factors mediating the impact of AKAP12+ fibroblasts on macrophages polarization, we next investigated cell-to-cell interactions using CellPhoneDB based on the scRNA-seq data. The network plot displayed that AKAP12+ fibroblasts communicated preponderantly with myeloid cells (figure 4A). We next explored the output and input signals of those cell types in the TNBC microenvironment. In contrast to AKAP12− fibroblast, AKAP12+ fibroblast exported some unique forward signals, such as WNT, KIT, SEMA3, FLT3, VEGF, PDGF, and GALECTIN, while also acquiring some unique input signals, such as WNT, LIFR, and TGF (figure 4B). In addition, focusing on the ligand–receptor interactions between fibroblasts and T cells or myeloid cells, we found several signaling pathways exclusive to AKAP12+ fibroblasts (figure 4C). Notably, L-34, a cytokine known for its impact on macrophage maturity and polarization in a CSF1R-dependent manner,28 was released by AKAP12+ fibroblast and absent from AKAP12– fibroblast, which could be considered as a possible mechanism underlying the association between AKAP12+ fibroblasts and M2 macrophages in TNBC microenvironment. Besides, we performed ST analysis of TNBC tissues from a public patient cohort (GSE210616).20 The result showed that the spatial distribution of AKAP12+ fibroblasts and CSF1R+ macrophages in TNBC tissues have overlapped significantly, as evidenced by the strong correlation between the population of CSF1R+ macrophages and AKAP12+ fibroblasts (R=0.74; figure 4D,E). Taken together, these findings suggested that AKAP12+ fibroblasts are spatially consistent with macrophages in TNBC, and may exert an influence on macrophage through IL-34/CSF1R signaling, which requires further verifications.

AKAP12+ fibroblasts potentially interact with macrophages via IL-34/CSF1R signaling in TNBC. (A) Network plot showing the interaction numbers and weights between indicated nine cell types based on single-cell RNA sequencing data. (B) Heatmap of outgoing and incoming signal patterns of the indicated cell types. Outgoing and incoming signals exclusive to AKAP12+ fibroblasts (AKAP12− fibroblasts for reference) are labeled by red arrows and colored in red, respectively. (C) Bubble plots displaying the ligand–receptor interactions between fibroblasts and T cells or myeloid cells. Interactions peculiar to AKAP12+ fibroblasts are marked by red frames. (D) Spatial distribution of AKAP12+ fibroblasts and CSF1R+ macrophages on a representative TNBC tissue section. (E) Pearson correlation analysis of proportions of AKAP12+ fibroblasts and CSF1R+ macrophages in TNBC tissues. AKAP12, A-kinase anchoring protein 12; CSF1R, macrophage-colony stimulating factor receptor; IL-34, interleukin-34; pDC, plasmacytoid dendritic cell; TNBC, triple-negative breast cancer.
AKAP12+ fibroblasts mediate macrophage M2 polarization through the PI3K/AKT/IL-34 axis
Based on the above findings, we further validated the role of IL-34 and investigated the specific signaling pathways by which AKAP12+ fibroblasts regulate macrophages polarization. qPCR and ELISA showed reduced expression and secretion levels of IL-34 in AKAP12−/− fibroblasts compared with the wild type (figure 5A). Furthermore, the addition of recombinant IL-34 protein to the co-culture system of BMDMs and AKAP12−/− fibroblasts can reverse the reduction of macrophage M2 polarization caused by AKAP12 deficiency (figure 5B,C). In addition, we isolated CAFs from TNBC patient samples and constructed AKAP12-overexpressing CAFs through lentiviral transfection (online supplemental figure 4A). Consistently, THP-1-differentiated macrophages exhibited impaired M1 polarization after co-cultured with AKAP12-overexpressing CAFs, as indicated by reduced membrane CD86 expression compared with the control (online supplemental figure 4B). Besides, the addition of an IL-34 neutralizing antibody to the co-culture system could restore the attenuation of macrophage M1 polarization induced by AKAP12 overexpression (online supplemental figure 4B). Coincidentally, analyses of the TCGA-TNBC cohort demonstrated a higher proportion of M1 macrophages in the IL-34 low group compared with that in the IL-34 high group (figure 5D). We next explored the biological pathways regulating IL-34 expression in AKAP12+ fibroblasts. Single-cell sequencing data was employed to identify gene expression and functional disparities between AKAP12+ fibroblasts and AKAP12− fibroblasts. DEG analyses and KEGG analyses showed that upregulated genes of AKAP12+ fibroblasts were enriched in several biological processes and signaling pathways including the PI3K-Akt pathway, which plays an essential role in tumorigenesis, progression, and metastasis of various cancers (figure 5E,F).29 Western blot assay further validated the higher PI3K-Akt pathway activation in wild-type fibroblasts than that in AKAP12−/− fibroblasts (figure 5G). To determine the impact of the PI3K-Akt pathway on IL-34 expression, we treated fibroblasts with an Akt activator SC79, and observed an increased IL-34 expression level in AKAP12−/− fibroblasts with SC79 (figure 5H). Conversely, treatment with an Akt inhibitor MK-2206 could inhibit AKAP12 overexpression-mediated enhancement of IL-34 expression in CAFs (online supplemental figure 4C). Taken together, AKAP12+ fibroblasts may promote macrophage M2 polarization through the PI3K/AKT/IL-34 axis.

AKAP12+ fibroblasts mediate macrophage M2 polarization through the PI3K/AKT/IL-34 axis. (A) qPCR and ELISA analyses of IL-34 in wild type and AKAP12−/− fibroblasts. (B–C) Flow cytometry analyses of MHC-II and CD206 expression on BMDMs from the indicated groups. (D) Proportion of M1 macrophages in IL-34 low and high groups of patients with TNBC from TCGA-BRCA cohort. (E) Volcano plot of DEGs between AKAP12+ fibroblast and AKAP12− fibroblast. The upregulated and the downregulated items were shown in red and blue, respectively. (F) KEGG analyses of DEGs upregulated in AKAP12+ fibroblast. (G) Western blot of phosphorylated AKT level in wild type and AKAP12−/− fibroblasts. (H) qPCR detecting IL-34 expression levels in wild type and AKAP12−/− fibroblasts treated with or without SC79. *p<0.05, **p<0.01, ***p<0.001, and NS, not significant; Student’s t-test or one-way ANOVA test. AKAP12, A-kinase anchoring protein 12; ANOVA, analysis of variance; BMDMs, bone marrow-derived macrophages; DEG, differentially expressed gene; IL-34, interleukin-34; KEGG, Kyoto Encyclopedia of Genes and Genomes; MFI, median fluorescence intensity; MHC, major histocompatibility complex; mRNA, messenger RNA; qPCR, quantitative PCR; TCGA-BRCA, The Cancer Genome Atlas Breast Invasive Carcinoma Collection; TNBC, triple-negative breast cancer.
Pharmacological blockade of the IL-34/CSF1R signaling enhances the efficacy of anti-PD-1 antibody in TNBC
The above findings that IL-34 plays a vital role in macrophage polarization induced by AKAP12+ fibroblasts drove us to investigate whether neutralization of IL-34 could intensify the efficacy of immunotherapy in TNBC. We constructed 4T1 cell-derived orthotopic TNBC mouse models and treated them with immunoglobulin G, anti-IL-34 antibody, anti-PD-1 antibody, and a combination of anti-IL-34 antibody and anti-PD-1 antibody, respectively (figure 6A). During the experiment, anti-IL-34 antibody, anti-PD-1 antibody, and combination therapy all effectively restricted orthotopic tumor growth, especially the combination therapy (figure 6B). In addition, compared with monotherapies, mouse models treated with combination therapy suffered a much smaller tumor burden at the endpoint of the study (figure 6C,D). To uncover the mechanism underlying the improved anti-tumor responses of combination therapy, we further parsed the immune constitution of the 4T1 cell-derived TME.

Pharmacological blockade of the IL-34/CSF1R signaling enhances the efficacy of anti-PD-1 antibody in TNBC (A) Schematic displaying the schedule of anti-PD-1 and anti-IL-34 treatment in 4T1 cell-derived orthotopic TNBC mouse models. (B) Tumor volumes of each treatment group during the experiment. (C–D) Volumes and weights of orthotopic tumors harvested from each group at the endpoint of experiment. (E–F) Flow cytometry analyses showing the population proportion of CD11b+F4/80+CD206+ macrophages and PD-1+CD8+ T cell in each group. (G) Serum levels of hepatic and renal function indicators from each group detected at the endpoint of the experiment. (H) Schematic diagram visualizing the effects of AKAP12+ fibroblasts on orchestrating immunosuppressive TNBC microenvironment. Patients with TNBC with immunotherapy resistant tend to have high population of AKAP12+ fibroblasts, which promote CSF1R+ macrophage M2 polarization by releasing IL-34, and thus impair CD8+ T cells function. *p<0.05, **p<0.01, ***p<0.001, and NS, not significant; one-way ANOVA test. AKAP12, A-kinase anchoring protein 12; ALT, alanine aminotransferase; ANOVA, analysis of variance; AST, aspartate aminotransferase; BUN, blood urea nitrogen; CSF1R, macrophage-colony stimulating factor receptor; FITC, fluorescein isothiocyanate; IgG, immunoglobulin G; IL-34, interleukin-34; PD-1, programmed cell death protein-1; SSC-A, side scatter-area; TNBC, triple-negative breast cancer.
The flow cytometry analyses showed that tumors collected from the combination therapy group had a significantly decreased population of CD206+ macrophages and exhausted PD-1+CD8+ T cells compared with that in monotherapy groups, indicating a reversal of immunosuppressive microenvironment (online supplemental figure 5A; figure 6E,F). No statistically significant difference in total macrophage population levels was observed among the treatment groups (online supplemental figure 5B). Compared with the control group, PD-1 expression on CD8+ T cells was significantly decreased in all three intervention groups, but there was no significant difference in PD-1 expression levels among the three groups (online supplemental figure 5C). Furthermore, the immunofluorescence assay showed that functional IFN-γ+ CD8+ T cells were significantly increased in the combination therapy group compared with the monotherapy group (online supplemental figure 5D). In addition, none of the treatment groups exhibited hepatic and renal toxicity (figure 6G). Collectively, this in vivo experiment highlighted that pharmacological blockade of the IL-34/CSF1R signaling may safely and effectively enhance the therapeutic efficacy of immunotherapy in TNBC.
Discussion
TNBC is a highly heterogeneous disease characterized by high aggressiveness, metastasis tendency, high recurrence rates, and poor prognosis. Given that conventional chemotherapies fail to satisfy the increasing needs of clinical treatment of TNBC, researchers are focusing on additional therapies and have already achieved some breakthroughs in targeted therapies, including PARP inhibitors, anti-androgen therapy, PI3K inhibitors, each provides an optimal treatment selection for the corresponding molecular subtypes of TNBC.30 In addition, some subtypes of TNBC exhibit a high population of TILs and are sensitive to ICIs, suggesting that immunotherapy is also a promising treatment option for patients with TNBC.7 Nevertheless, considering the low percentage of patients with TNBC who benefit from the existing immunotherapy,7 unraveling the determinants in TME that influence the TNBC response to immunotherapy is quite important to guide patient stratification and the development of combination therapy strategies.
TNBC is distinguished from other malignant tumors by the fact that it is a pro-fibroproliferative tumor.31 The presence of CAFs and the components they secrete result in a TNBC microenvironment surrounded by a dense extracellular matrix (ECM) that promotes tumor cell proliferation and metastasis and severely limits drug penetration into the tumor.32 In addition, CAFs can interact with both innate and adaptive immune cells through the secretion of various factors, shaping an immunosuppressive TME that promotes tumor immune escape.33 Therefore, targeting CAFs represents a highly potential direction for anticancer therapeutic development and there are already some preclinical and clinical studies on CAFs-targeted therapy to enhance antitumor immune activity.34 Besides, some studies have explored the full landscape of CAFs in breast cancer at the single-cell resolution level. For example, a CAFs subset with high expression of five surface markers (FAP, CD29, α-SMA, S100-A4/FSP1, PDGFRβ) has been identified as CAF-S1 and found to play a critical role in forming an immunosuppressive TME in TNBC via interaction with T lymphocytes.10 Further single-cell analysis of CAF-S1 revealed eight CAF-S1 subgroups with distinct gene signatures, providing a deeper understanding of cluster heterogeneity associated with immunosuppression.35 In addition, another CAF subtype named matrix CAFs, which is defined by ECM-related gene signatures, has been demonstrated an ability to secrete CXCL14, indicating a role as a tumor immune response modulator.36 Hence, given the phenotypic and functional heterogeneity of CAFs, identifying key immunoregulatory subtypes or characteristic molecules of CAFs may facilitate the achievement of more precise and effective subtype-specific therapies. Here, through integrated multiomics analyses, we expanded the CAFs markers with biological function and clinical value by identifying a previously undescribed AKAP12+ CAFs subset, which is closely related to the immunotherapy responses and prognosis in TNBC. In addition, although AKAP12+ CAFs are closely associated with the myCAFs at the transcriptional level, the expression profiles are not identical. AKAP12+ CAFs also present unique functions such as IL-34 secretion, and are therefore worth exploring as a new subpopulation.
AKAP12, a scaffolding protein, is a negative mitotic regulator that functions as a metastasis suppressor in tumor cells.12 13 Intriguingly, hypoxia induced the expression of a specific variant of AKAP12, AKAP12v2, which enhanced the migration and metastasis of melanoma cells through protein phosphorylation, suggesting that AKAP12 may act as a double-edged sword and is regulated by the TME12.37 More importantly, a pan-cancer analysis found that AKAP12 expression was upregulated in anti-VEGF therapy-resistant tumors and positively correlated with the abundance of CAFs and poor prognosis in various types of cancer.16 Consistently, our study showed a predominant expression of AKAP12 on CAFs in the TNBC microenvironment. Notably, the tendencies toward non-response to immunotherapy and poor prognosis observed in patients with TNBC with either high AKAP12 expression or high AKAP12+ CAFs population suggests that AKAP12+ CAFs is an essential CAFs subpopulation that profoundly affects immunotherapy and clinical outcomes in TNBC. On the other hand, we noticed in our single-cell transcriptome results that AKAP12 is also expressed in some endothelial cells. Some studies have reported that AKAP12 mediates the repulsion between tumor cells and endothelial cells and inhibits endothelial cell migration1.15 38 The role of AKAP12+ endothelial cells in TNBC deserves further exploration.
Growing studies have attached importance to the impact of CAFs on the TIME, but in-depth explorations are still insufficient.33 Given that the immunotherapy responses of TNBC are highly correlated with both the expression level of AKAP12 and the population level of AKAP12+ CAFs in TME, it is reasonable to presume that AKAP12+ CAFs exert a great influence on the immune landscape of TNBC in certain ways, which was verified by the results of our high throughput CyTOF analysis. In addition, our investigation also highlighted that the presence of AKAP12+ CAFs stimulates enrichment and tumor-promoting immunosuppressive M2 polarization of macrophages in TNBC. A study started with antihistamines has shown that the activation of histamine receptor H1 stimulates macrophages M2 polarization and increased expression of immune checkpoint, leading to T cells dysfunction and immunotherapy resistance in TNBC, indicating a close relations between M2 macrophages and immunotherapy responses.39 Furthermore, a model for immunotherapy prediction has been developed based on the population of M2 macrophages in TNBC, further suggesting the potential significant influence of M2 macrophages on immunotherapeutic responses.40 Therefore, the essential role of AKAP12+ CAFs play in the immunotherapy responses of TNBC is mostly likely mediated by the regulation of macrophages. Besides, we found that there were no significant disparities in immune cell population percentages including neutrophils and T cells between high and low AKAP12+ CAFs population level groups, indicating that AKAP12+ CAFs do not restrict the penetration of immune cells into tumors through potential matrix remodeling activity.41 Therefore, the combination therapy approaches for TNBC TME with these features should be more focused on innate immune regulation than on enhancing the TIL population.
CAFs maintain a tight connection with macrophages in TME by releasing various cytokines.33 42 For example, in TNBC, CAFs can promote migration of monocytes to the tumor site and differentiation of these cells towards immunosuppressive STAB1+TREM2high lipid-associated macrophage subgroups contributing to the immunotherapy resistance through CXCL12-CXCR4 axis.43 Our ST analysis also demonstrated that AKAP12+ CAFs can interact with macrophages via IL-34-CFS1R signaling, an axis known to promote macrophage M2 polarization.44 In addition, there was a significant spatial distribution consistency between AKAP12+ CAFs and CSF1R+ macrophages in TNBC tissues as shown by our result of ST analysis, suggesting a substantial impact of AKAP12+ CAFs on recruitment of CSF1R+ macrophages. Beyond macrophages, AKAP12+ CAFs can also communicate with T cells via the CXCL16-CXCR6 axis according to our analysis, which was been reported to modulate T cells residency and activity.45 46 Since T cells-targeted remedies still occupy a dominant position in TNBC immunotherapy, it is worthwhile to investigate the underlying intercellular effects of those two cell types, which may shed a new light on the interpatient diversity of TNBC immunotherapy responses. Besides, we also found additional AKAP12+ CAFs-centered signal cross-talks in TNBC tissues such as WNT, VEGF, TGF-β, etc. Those signal pathways are extensively involved in tumor development, angiogenesis and immunity,47–49 implying potential pleiotropic effects of AKAP12+ CAFs in the TNBC microenvironment that deserve further exploration. Furthermore, through transcriptome and pathway enrichment analyses we demonstrated that AKAP12, in fibroblasts, modulates the transcription of IL-34 via the PI3K-Akt pathway, a finding that has not been reported before. Previous studies have revealed the involvement of PI3K-Akt signaling in the regulation of tumor development and drug resistance by cells in TME, including CAFs.29 Our finding contributes to the in-depth understanding of this signaling pathway in tumor immunity. Nevertheless, the specific mechanism by which AKAP12 triggers the PI3K-Akt signaling pathway and the potential effects of AKAP12 on biological activities of CAFs like migration or acquirement of other tumor-associated qualities remain to be determined.
Targeting the IL-34-CSF-1R axis has emerged as a novel combination therapeutics option with ICIs. It has been consistently reported that in various murine cancer models including a breast cancer model and a patient-derived xenograft model, expression of IL-34 in tumor abrogated the therapeutic effects of PD-1 blockade, and intervention targeting IL-34 boosted the immunotherapeutic effects in combination treatment models.50 Preclinical works on targeting IL-34 have also been conducted in colorectal cancer and lung cancer models,51 underling the clinical translation potentials of IL-34 targeted therapy combined with immunotherapy. In this context, immunofluorescence staining of our patient cohort revealed that almost half of patients with TNBC harbored a high AKAP12+ CAFs population, a potential group of patients who benefit from the combination therapy.
Conclusions
In conclusion, we provided a unique insight into the mechanism of immunotherapy resistance in TNBC: Namely, the presence of a tumor-promoting AKAP12+ CAFs in the TNBC microenvironment that promotes macrophage M2 polarization through IL-34-CFS1R signaling to produce immunosuppressive TME associated with poor immunotherapy effect. The role of AKAP12+ CAFs and IL-34 signaling in TNBC immunotherapy resistance has not been adequately investigated previously. Our finding not only implied the complicated effects of AKAP12 in cancers but also advanced the knowledge of the intricate cellular interplays in the immunosuppressive microenvironment of TNBC, providing a wider perspective on drug development.
Data availability statement
All data relevant to the study are included in the article or uploaded as supplementary information. The data of The Cancer Genome Atlas Breast Invasive Carcinoma Collection and METABRIC cohorts are obtained from the UCSC Xena website (https://xenabrowser.net/datapages/) and the cBioPortal website (https://www.cbioportal.org/), respectively. The single-cell sequencing data of the patient with triple-negative breast cancer cohort receiving anti-programmed cell death protein-1 treatment are downloaded from the website http://biokey.lambrechtslab.org. The spatial transcriptomics data are available from series GSE210616 in the GEO website (https://www.ncbi.nlm.nih.gov/geo/). Other data analyzed in this study are included in the article and supplementary materials.
Ethics statements
Patient consent for publication
Ethics approval
The study was approved by the Ethics Committee of the First Affiliated Hospital of Zhengzhou University (ID: 2024-KY-0756-001). Participants gave informed consent to participate in the study before taking part.
References
Supplementary materials
Supplementary Data
This web only file has been produced by the BMJ Publishing Group from an electronic file supplied by the author(s) and has not been edited for content.
Footnotes
ZL, SH and XZ contributed equally.
Contributors ZL, SH, and XZ designed and analyzed data, performed experiments, and wrote the manuscript. WX and FJ contributed to the acquisition and interpretation of data. MG provided scientific input and revised the manuscript. YD and JW supervised and conceived the entire project. YD is responsible for the overall content as the guarantor.
Funding This study was supported by grants from the Henan Science Found for Distinguished Young Scholars (YXKC2022026) and Medical and Health Science and Technology Plan Project of Zhejiang Province (2025699757).
Competing interests None declared.
Provenance and peer review Not commissioned; externally peer reviewed.
Supplemental material This content has been supplied by the author(s). It has not been vetted by BMJ Publishing Group Limited (BMJ) and may not have been peer-reviewed. Any opinions or recommendations discussed are solely those of the author(s) and are not endorsed by BMJ. BMJ disclaims all liability and responsibility arising from any reliance placed on the content. Where the content includes any translated material, BMJ does not warrant the accuracy and reliability of the translations (including but not limited to local regulations, clinical guidelines, terminology, drug names and drug dosages), and is not responsible for any error and/or omissions arising from translation and adaptation or otherwise.